
Despite strong economic data in both the US and Europe, expectations of delayed rate cuts caused risk markets to pullback from their recent floating on high with the USD falling for the first time in weeks. Wall Street dropped nearly 1% across the board, dragging European stocks down which should translate into a poor opening here in Asia today. With the fall in USD the Australian dollar managed to just get back above the 65 cent level after making a new monthly low.
10 year Treasury yields rose again with a surge through the 4.4% level while Brent crude lifted above the $89USD per barrel level for a new weekly high. Meanwhile gold is surging irregardless of USD direction, now picking up pace as it almost pushes through the $2300USD per ounce level.
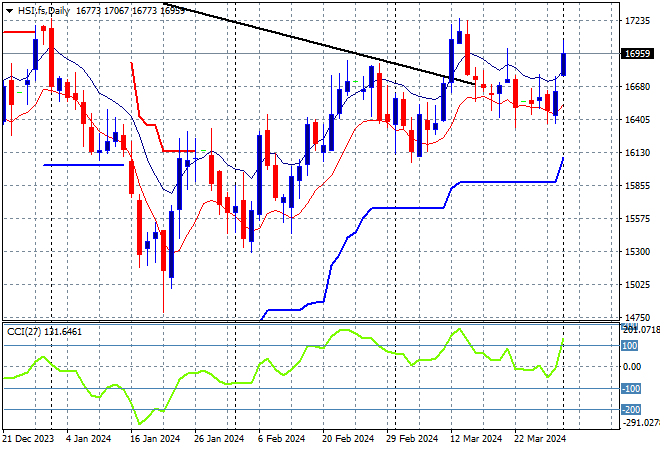
Looking at markets from yesterday’s session in Asia, where mainland and offshore Chinese share markets are going in different directions again with the Shanghai Composite still well above the 3000 point level but unable to make any headway while the Hang Seng has surged more than 2% higher, closing at 16931 points.
The daily chart was starting to look more optimistic with price action bunching up at the 16000 point level before breaking out in the previous session trying to make a run for the end of 2023 highs at 17000 points with the downtrend line broken. However this has been thwarted as monthly resistance levels are kicking in, although support is firming at the 16400 point area:
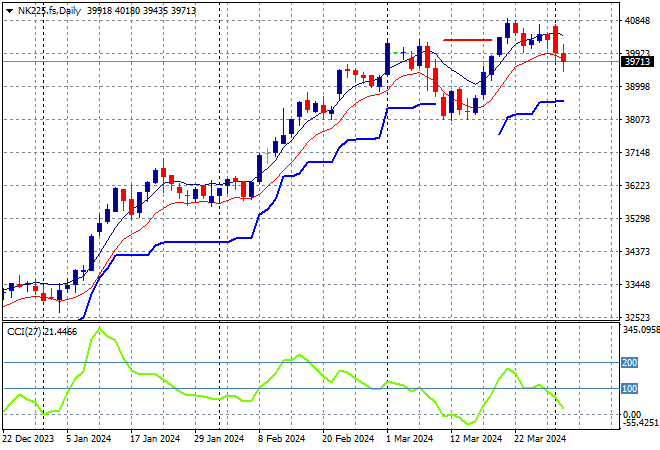
Japanese stock markets were quite flat, with the Nikkei 225 closing just 0.1% higher at 39827 points.
Trailing ATR daily support was never threatened by price action after this bounce went beyond the September highs at the 33000 point level with daily momentum getting back to overbought readings with a significant breakout last month above the 40000 point level. This has now turned into short term resistance so watch for a further retracement below:
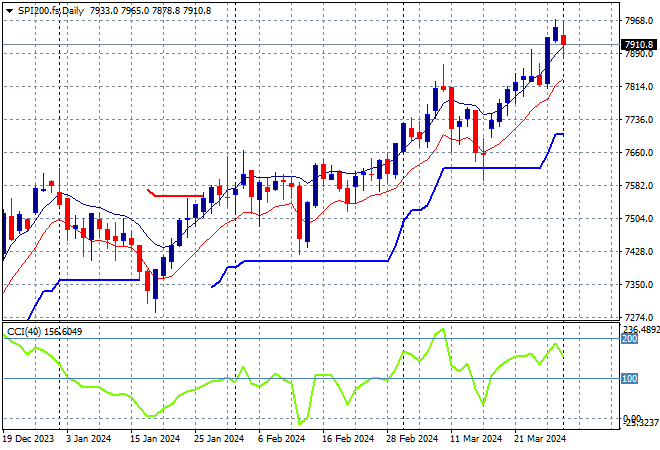
Australian stocks were supposed to perform better but the ASX200 actually closed 0.1% lower to 7886 points.
SPI futures are down at least 0.4% on the poor showing on Wall Street overnight. The daily chart was looking firmer with the medium term uptrend and short term price action coming together to take out the previous December highs. As I said previously, watching for any continued dip below the low moving average could see a significant pullback but watch ATR support which has been defended so far:
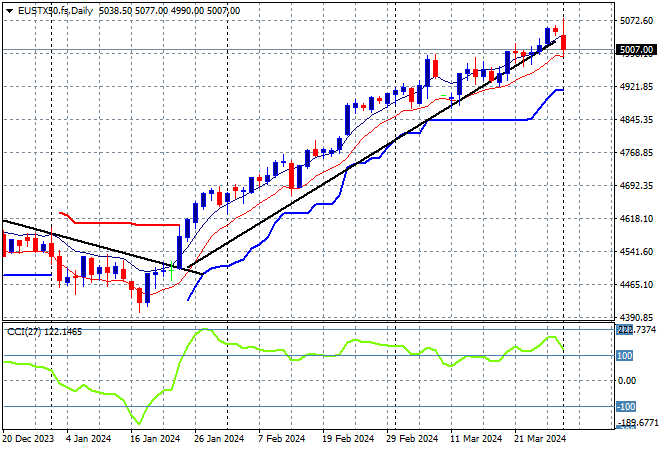
European markets were unable to continue their pre Easter trend with the German DAX the biggest loser, helping push the Eurostoxx 50 Index nearly 1% lower to finish at 5042 points.
The daily chart shows price action still on trend after breaching the early December 4600 point highs but daily momentum retracing slightly out of an overbought phase. This is looking to turn into a larger breakout as futures indicate another pullback for tonight’s session:
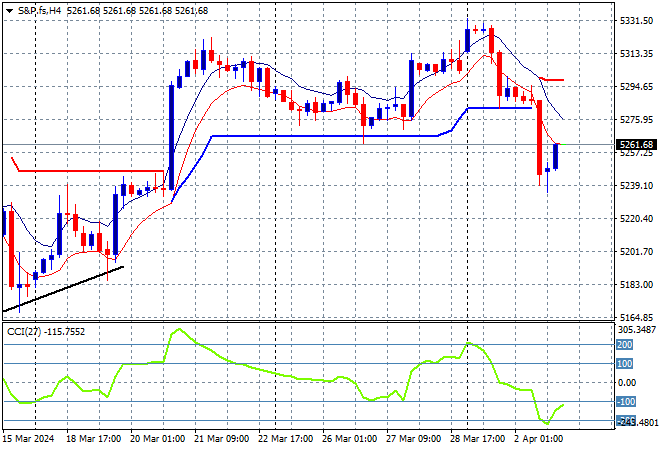
Wall Street is putting in more downside with this week’s downtrend firming as the NASDAQ lost nearly 1% while the S&P500 fell 0.7% on the rate cut concerns, closing at 5205 points.
The four hourly chart shows a consolidation possibly turning into a reversal here as price action pushes through short term support while momentum swiftly gets into a negative phase. Watch for any break below the 5240 point area:
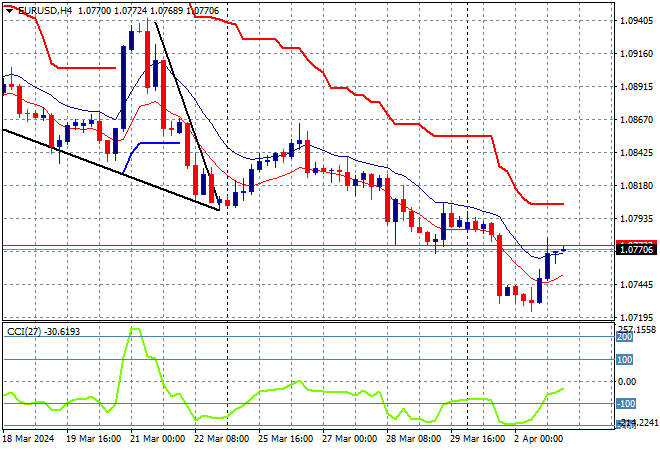
Currency markets have been in the thrall of USD for sometime now so a small reversal overnight was not unexpected following a series of central bank meetings and dovish ECB signalling but this time strong US economic data pushed King Dollar over as rate cut expectations weighed on the complex. As a result Euro rebounded to almost get through the 1.08 handle overnight.
The union currency seemed to have support anchored at the 1.08 level but the medium term price action was always suggesting a return to or below that level as momentum was never positive, with the 1.07 level still in sight despite the overnight small reversal:
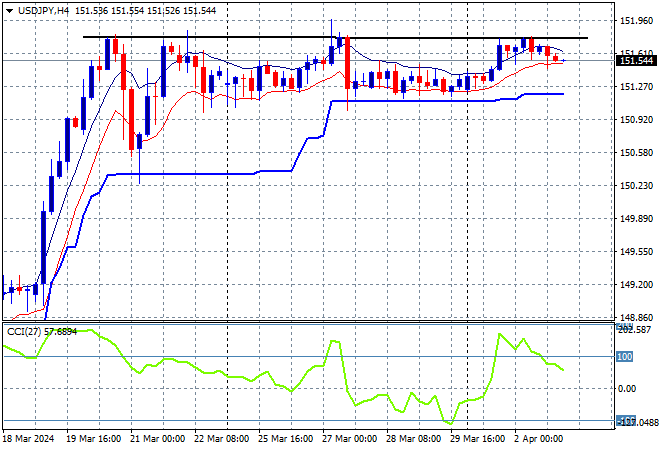
The USDJPY pair was unable to make many gains despite what looked like a very good breakout setup on the four hourly chart with the falling USD reloading this potential for another move later in the week as it consolidates at the mid 151 level.
The medium term picture remains very optimistic as Yen sold off due to BOJ meanderings but momentum is now trying to get back into overbought mode while ATR support remains firm at the 151 handle proper:
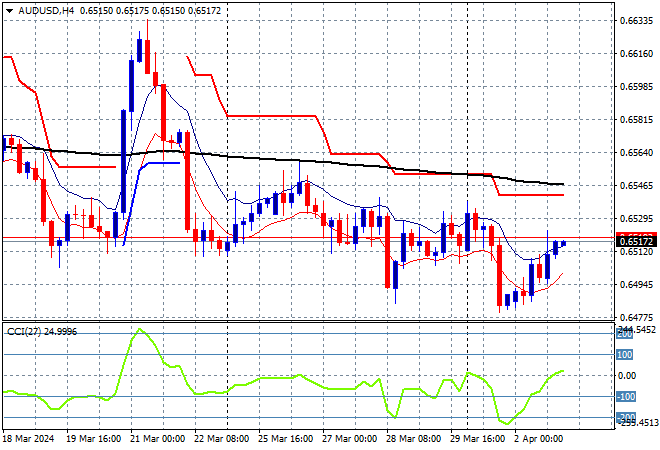
The Australian dollar was able to bounce back slightly after falling below the 65 handle previously, now back above but not yet returning to its start of week position.
The Aussie has been under medium and long term pressure for sometime before the RBA and Fed meetings and while the previous temporary surge looked strong, it wasn’t overbought on the four hourly chart and had not surpassed support from last week’s consolidation phase. Watch for the 65 cent handle to fail again as support here after last week’s monthly CPI print:
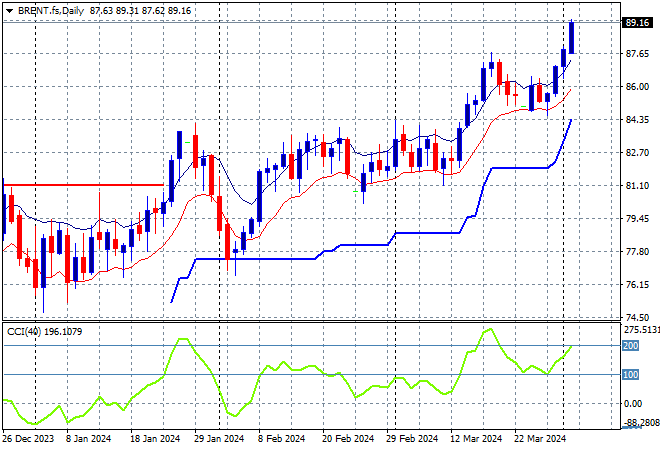
Oil markets are continuing their breakouts following the attacks on Russian refineries with Brent crude again pushing higher to settle just above the $89USD per barrel level, exceeding the previous weekly highs.
After retracing down to trailing ATR daily support at the $77 level, price had been bunching up around the February highs at the $84 level with short term momentum definitely overbought and signalling potential upside from here:
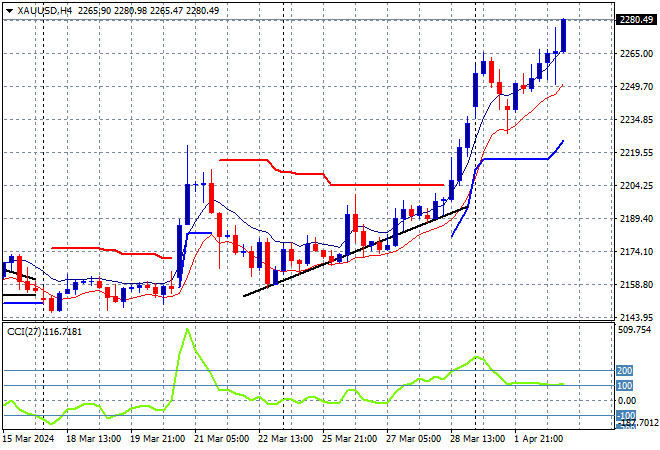
Gold just keeps climbing to new highs through any volatility with another surge overnight despite the rate cut concerns pushing the shiny metal almost through the $2300USD per ounce level, closing at the $2280 level as of this morning.
Last week daily momentum was nearly off the charts – never a good sign – with short term support at the $2100 level turning to what could be rock solid medium term support but still the critical area to watch ahead on a likely pullback due to excessive volatility. So far though – no signs of any stopping:
Glossary of Acronyms and Technical Analysis Terms:
ATR: Average True Range – measures the degree of price volatility averaged over a time period
ATR Support/Resistance: a ratcheting mechanism that follows price below/above a trend, that if breached shows above average volatility
CCI: Commodity Channel Index: a momentum reading that calculates current price away from the statistical mean or “typical” price to indicate overbought (far above the mean) or oversold (far below the mean)
Low/High Moving Average: rolling mean of prices in this case, the low and high for the day/hour which creates a band around the actual price movement
FOMC: Federal Open Market Committee, monthly meeting of Federal Reserve regarding monetary policy (setting interest rates)
DOE: US Department of Energy
Uncle Point: or stop loss point, a level at which you’ve clearly been wrong on your position, so cry uncle and get out/wrong on your position, so cry uncle and get out!