CBA’s head of Australian economics, Gareth Aird, has released a research note explaining why the latest unemployment print of 3.7% is way out of kilter with the economy.
Aird expects the nation’s unemployment rate to rise over 2024 to 4.5% by year’s end, which would be 0.2% higher than the Reserve Bank of Australia’s (RBA) target.
While I wholeheartedly agree with Aird’s assessment, I expect the unemployment rate to be a little higher by year’s end. Although, I accept Aird’s argument that the gig economy makes it easier to maintain some form of employment.
Regardless, CBA still expects the RBA to commence an interest rate easing cycle beginning in September 2024.
Gareth Aird’s report is presented below.
Key Points:
- The strength of the February labour force survey looked at odds with the material slowdown in economic growth in 2023.
- Employment is a lagging indicator and we continue to expect jobs growth will moderate and that the unemployment rate will resume its upward trend over 2024 – we put the end year unemployment rate at 4.5%.
- Our RBA call is unchanged and we expect an easing cycle to commence in September (we have 75bp of rate cuts by end2024 in our profile and a further 75bp of easing in 2025).
The economic growth vs employment conundrum:
On 10 April 2019 former RBA Deputy Governor Guy Debelle delivered a speech titled “State of the Economy”.
Dr Debelle stated at the opening, “today I am going to discuss the Bank’s assessment of the current economic situation both in the world and in the Australian economy. I will also talk about some of the key uncertainties about the future economic path”.
“In particular, I will highlight the tension between labour market data and output data not only here in Australia but also in a number of economies around the world. How that tension resolves in the period ahead will be an important determinant of the future path of monetary policy.”
Economic outcomes post-pandemic have been very different to pre-pandemic. But Dr Debelle’s musings in 2019 feel particularly apt again following last week’s strong labour force survey against well below trend GDP growth.
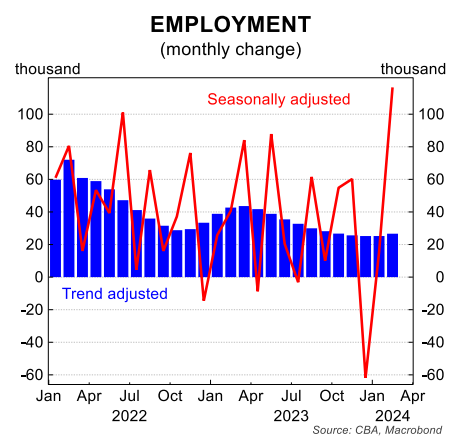
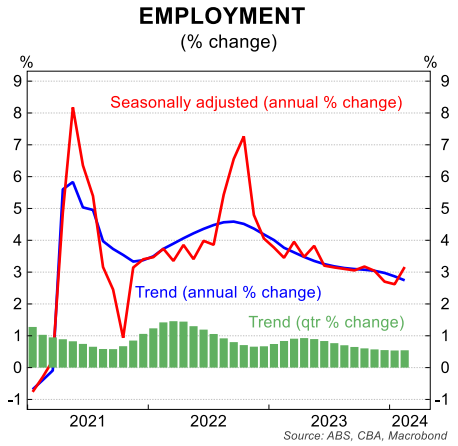
According to the ABS, employment growth surged by 116.5k in February. The massive lift in hiring dropped the unemployment rate from 4.1% in January to 3.7%.
We and most analysts expected a decent rebound in employment in February because of a shift in seasonal hiring patters. But it’s fair to say that the huge lift in employment was a big surprise.
Indeed the 0.4ppt fall in the unemployment rate was the larger shock to us and the entire forecasting community (the forecast range for the unemployment rate in February was 3.9% to 4.2%; CBA (f) 4.0%).
The ABS noted last week that, “the large increase in employment in February followed larger-than-usual numbers of people in December and January who had a job that they were waiting to start or to return to. This translated into a larger-than-usual flow of people into employment in February and even more so than February last year”.
The upshot is that the annual rate of employment growth accelerated to 3.2% in February. Over the same period the working age population grew by a very strong 2.9% and the employment to population ratio is close to a record high.
In isolation these outcomes imply the economy should be growing reasonably strongly. But labour market data should never be viewed in isolation. It should be assessed against GDP growth to ascertain a more complete picture of the evolution of the economy.
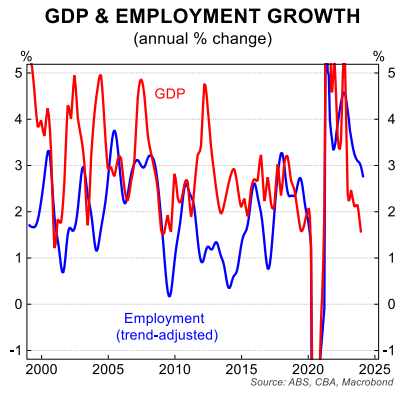
As we have covered previously, momentum in the economy slowed materially over 2023. The quarterly changes over 2023 read 0.6%, 0.5%, 0.3% and 0.2% (latest).
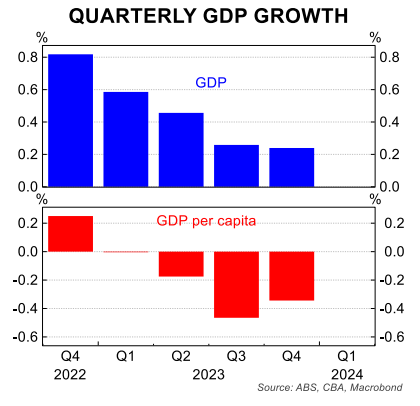
Indeed the six-month annualised pace of GDP growth to the December quarter fell to 1.0%. This compares with population growth of ~2.5%/yr. This means that the economy went backwards a lot in per capita terms over H2 23.
It is unusual to have such strong growth in employment in a slowing economy that is running well below trend. But it’s not unprecedented.
To help make sense of the apparent disparity between strong employment growth and weak GDP growth it’s worth turning to ABS analysis done previously on the topic.
The ABS note that in terms of defining the precise timing of a turning point, the Henderson trend is superior to using ‘through the year’ analysis based on seasonally adjusted data.
The February labour force data showed a lift in the annual rate of employment growth on a seasonally adjusted basis. But trend employment growth has eased over the past year.
There is typically a lagged relationship between employment growth and GDP growth. My colleague Stephen Wu has crunched the numbers and notes that since 2005 the strongest correlation between quarterly GDP and employment growth occurs after two quarters.
The ABS suspended trend estimates for the national accounts in June 2019 and has not yet resumed publishing them. But it is clear that trend GDP growth declined materially in 2023.
The upshot is that we should be relatively confident that employment growth will continue to moderate from here. In turn, that will see the unemployment rate move higher. That is our base case.
What about the other data:
Other data beyond the usual relationship between GDP growth and employment supports the notion that employment growth will continue to moderate and the jobless rate will lift.
Indeed other survey data looks at odds with the most recent monthly labour force survey.
Seek jobs ads were down by 2.5% in February to sit 18.6% lower over the year. Jobs ads have been in a trend decline since May 2022 (the month the RBA commenced their tightening cycle). Falling job ads are an indication of a loosening labour market.
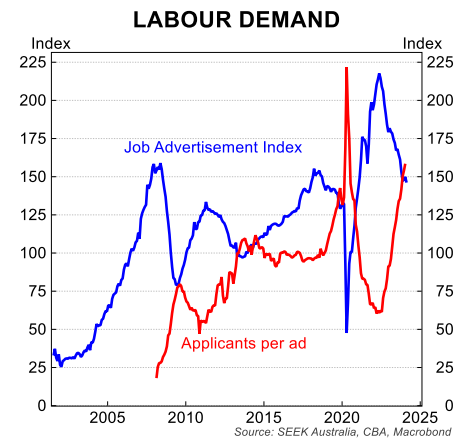
Also according to Seek, the number of applicants per job ad continued to march higher in January (latest available). Applicants per job ad are up by 82.8% over the year. Indeed applications per job ad are ~50% higher than pre-pandemic levels.
This is a sign that the labour market has become increasingly competitive.
The increase in labour market competitiveness is weighing on growth in advertised salaries. According to Seek advertised salaries rose by 0.2% in January, the slowest monthly rate of growth since December 2021. As the facing chart shows, the monthly growth rate in advertised salaries has cooled over the last four months.
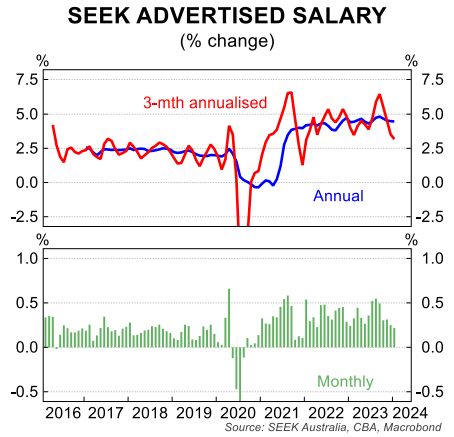
Again, this is consistent with a loosening labour market. And it will also help moderate the pace of wages growth in 2024 which will assist with the disinflation process.
At CBA we are able to track the total number of salary payments into CBA bank accounts. The annual change in the number of salary payments into CBA bank accounts has been trending down.
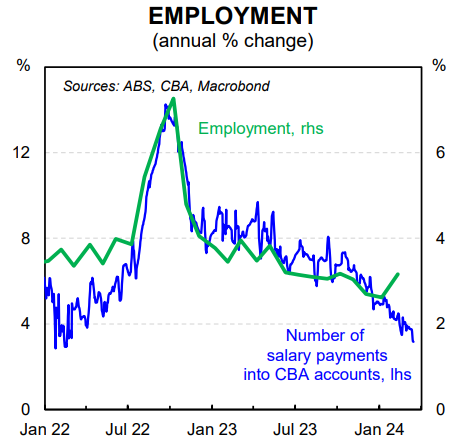
The lift therefore in the annual rate of employment growth as measured in the ABS monthly labour force survey is at odds with our data.
The NAB monthly business survey also points to a slowdown in the pace of employment growth.
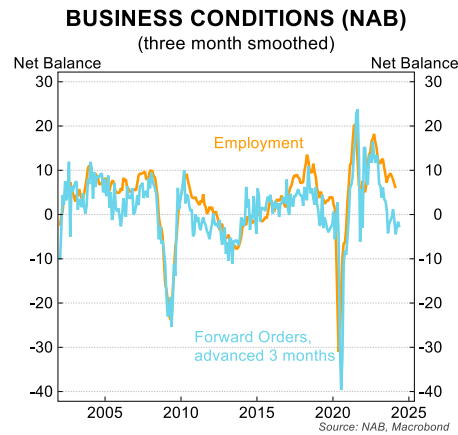
Forward orders have historically had a very good leading relationship with hiring. Forward orders according to the NAB survey have been in negative territory over the last three months and sit below their long run average.
This is consistent with the weakness in private demand evident in the national accounts.
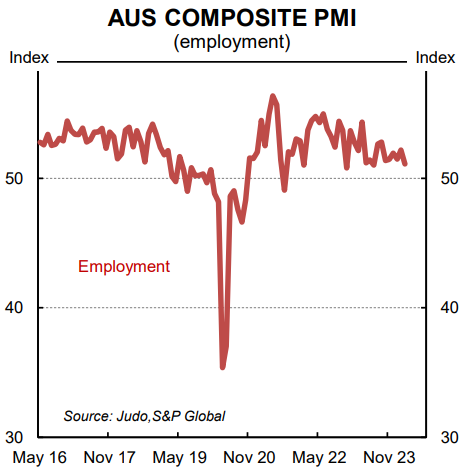
Finally, the employment index from the Judo Composite PMI has trended down over the past year. The index over the past six months has been tracking below its pre-pandemic average. To be fair, the survey doesn’t have a long history (dates back to 2016). But the Judo PMIs are part of the global S&P suite and the survey methodology is sound.
Labour market flexibility also worth considering:
The labour market has never been more flexible. And the ability for workers to dip in and out of employment is high. The ‘gig’ economy for example has made it much easier for people to obtain some work even if it’s not their preferred place of employment.
The upshot is that labour market slack can rise even if it’s not reflected in the unemployment rate.
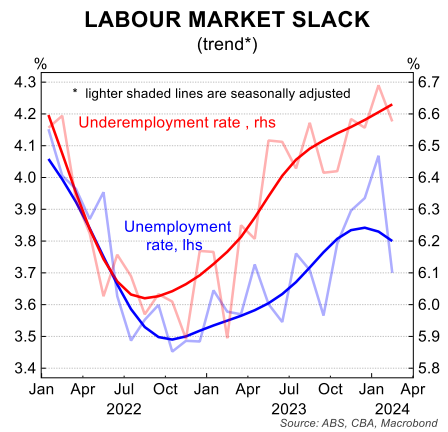
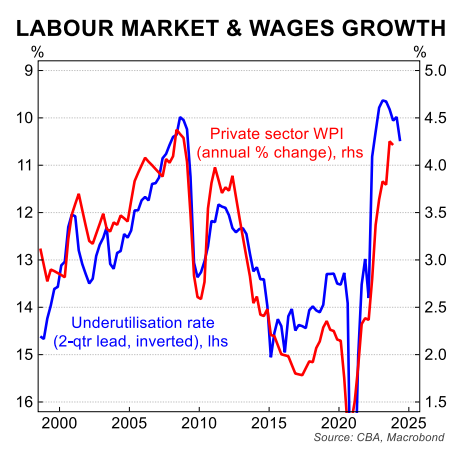
On that score, the underemployment rate is a particularly useful measure of labour market slack. And despite the fall in the unemployment rate in February, the underemployment rate continued on its upward trend.
The sum of the underemployment rate and underemployment rate is the underutilisation rate. It is the indicator of the labour market that is most closely correlated with wages growth.
Trend underutilisation was flat in February at 10.4%. It is 0.9ppts above its cyclical low of 9.5% in late 2022.
All eyes on upcoming labour market data:
The March labour force survey prints on 18 April (i.e. ahead of the May RBA Board meeting). The data should help us better understand what has happened in the labour market over the last four months.
We would not be surprised to see some statistical payback, particularly on the unemployment rate.
The RBA, of course, will ultimately be guided by the data. If the labour market holds up better than we anticipate and the unemployment rate fails to lift more meaningfully than we forecast the RBA could keep rates higher for longer.
Notwithstanding, we have made no changes to our economic forecasts or RBA call following the February labour force survey.
We continue to expect the unemployment rate to lift to 4.5% by end 2024. And for the RBA to commence an easing cycle in September.
Final thoughts from Debelle:
Dr Debelle concluded his April 2019 speech with the following comments:
“Domestically, I have highlighted the challenge in determining the current and future pace of growth in the economy posed by the conflicting signals provided by the labour market, the GDP data and the business surveys”.
“How those tensions are resolved will play a critical role in whether we continue to make satisfactory progress in achieving the goals of full employment and the inflation target.”
History shows that the signals from the GDP data ultimately proved more accurate in determining the path of monetary policy.
The RBA cut the cash rate by 25bp in June 2019, two months after Dr Debelle’s speech. And the RBA delivered a further 50bp of easing in the second half of 2019.
We expect the signals from the GDP picture will once again be the better guide to the outlook for interest rates.
