
The latest US GDP figures took away confidence from US share markets and their European counterparts as the USD found some strength as traders anticipate the upcoming inflation print that could shake things up even further. Bond markets were more sanguine while Bitcoin went nuts returning to its November 2021 highs, while the Australian dollar fell sharply below the 65 cent level after a very dovish hold from the RBNZ yesterday.
10 year Treasury yields range traded just below the 4.3% level, as Brent crude pulled back a little to close below the $82USD per barrel level. Meanwhile gold was able to push above the $2030USD per ounce level.
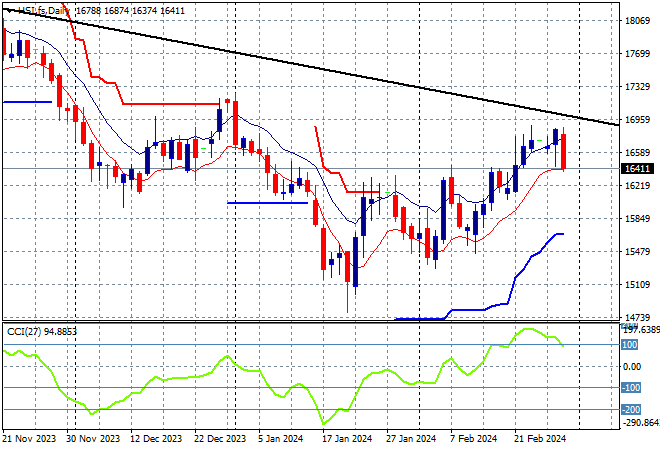
Looking at markets from yesterday’s session here in Asia, where mainland Chinese share markets reversed their post Chinese New Year rally with the Shanghai Composite down nearly 2% while the Hang Seng is off by more than 1.5% to 16536 points.
The daily chart was starting to look more optimistic with price action bunching up at the 16000 point level, ready to possibly make a run for the end of 2023 highs at 17000 but as I warned previously, watch for any retracement down to the low moving average that could presage a full breakdown to the long term trend (black line down):
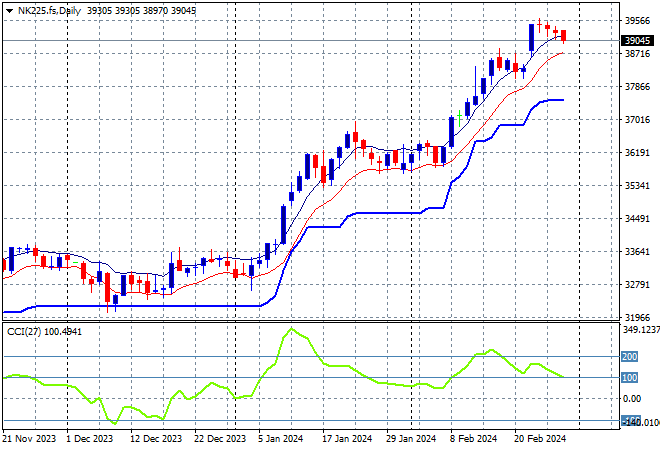
Japanese stock markets also went nowhere with the Nikkei 225 down 0.1% to 39208 points.
Trailing ATR daily support was never threatened by price action after this bounce went beyond the September highs at the 33000 point level with daily momentum getting back to overbought readings with a significant breakout. A selloff back to ATR support at 32000 points remains unlikely as the November highs are wiped out in this breakout but I’m cautious of a strong pullback here on any volatility:
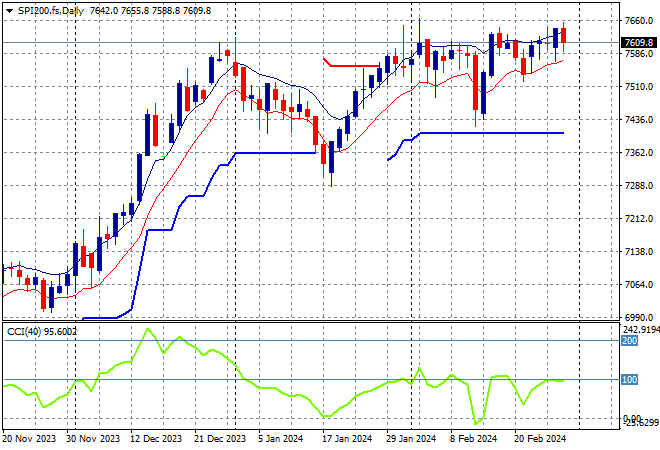
Australian stocks continue their flat start to the trading week with the ASX200 down a few points to remain above the 7600 point level, closing at 7660 points.
SPI futures are down only slightly, despite the poor result on Wall Street overnight. The daily chart was looking firmer with the medium term uptrend and short term price action coming together to take out the previous December highs. As I said previously, watching for any continued dip below the low moving average could see a significant pullback but watch ATR support which has been defended so far:
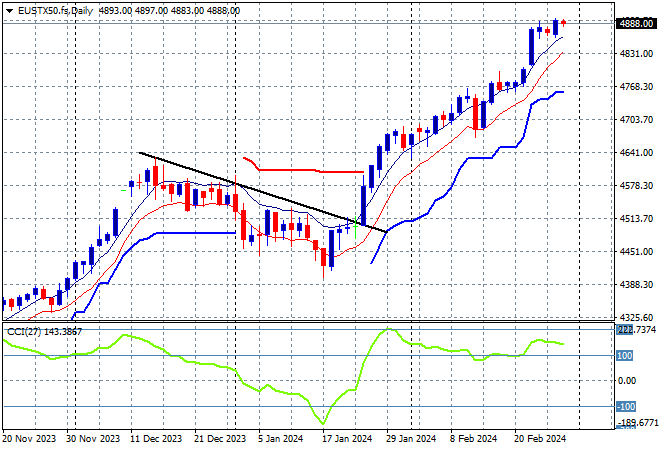
European markets saw divergence in confidence across the continent, with the German DAX lifting higher while peripheral stocks dragged the Eurostoxx 50 Index down, eventually finishing dead flat at 4883 points.
The daily chart shows price action still on trend after breaching the early December 4600 point highs but daily momentum has now retraced from being well overbought with futures indicating a further pullback this evening. This is looking to turn into a larger breakout but watch for any falls below the low moving average or ATR support proper:
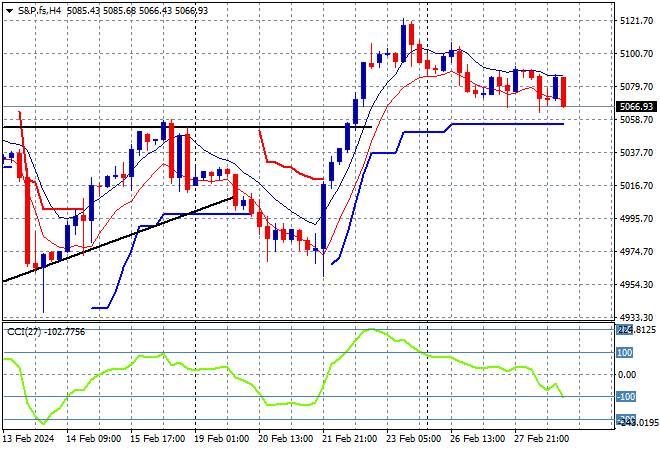
Wall Street also couldn’t find any confidence, with poor sessions across the whole complex with the NASDAQ down more than 0.5% while the S&P500 finished 0.2% lower to close at 5069 points.
The four hourly chart previously showed short term momentum trying to get out of oversold territory with a nascent bearish double head pattern plus a break below the daily trend line from the January lows broken. I remain wary of short term momentum again floundering, now in negative territory so watch ATR support at the 5050 line very closely:
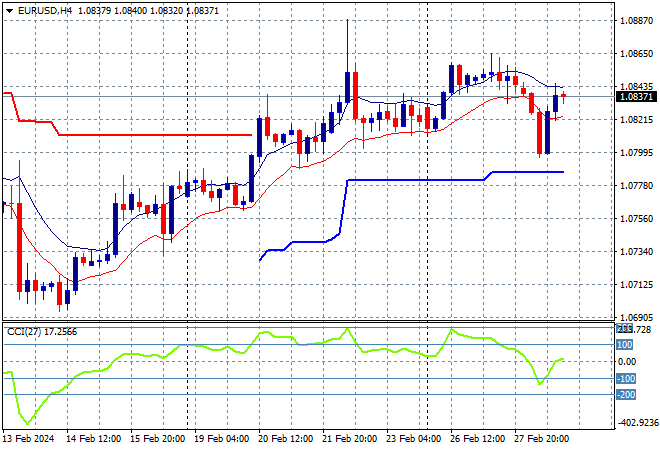
Currency markets are still somewhat anti USD but are slowly changing their tune as the economic calendar ramps up with Euro breaking down below the 1.08 handle overnight before slightly recovering, which could be predicting the possible volatility around the US inflation print that is upcoming.
The union currency is still at a new monthly high with a view to getting back to the 1.09 handle as momentum was overbought in the short term and price action breaking out as well before last night’s wobbles. Watch for any pullback to the 1.0820 level and any test of the 1.08 handle itself however:
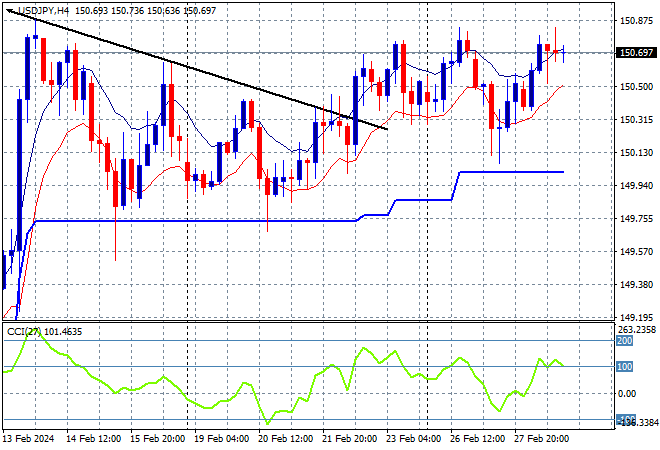
The USDJPY pair remains stable with a small breakout above the descending triangle pattern on the four hourly chart that takes it above the mid 150 handle and back to the spike highs from several weeks ago.
This is looking very optimistic as Yen sells off due to BOJ meanderings with momentum now back to slightly overbought settings in the short term, so I’m watching for any major pullback to the 150 level proper as part of a mid trend consolidation, however unlikely:
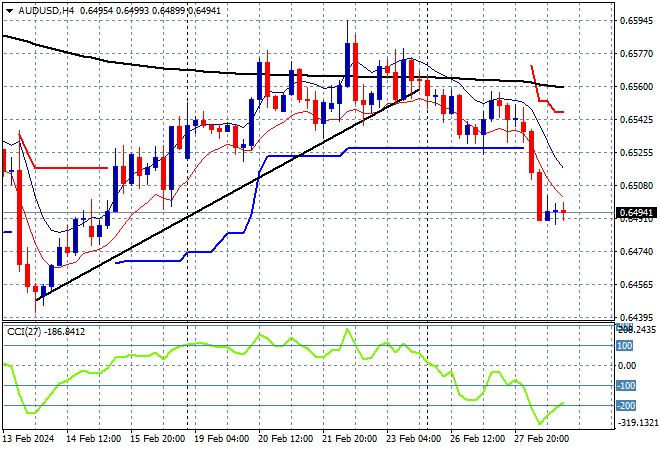
The Australian dollar is showing its true colours by being one of the weakest undollars with a breakdown overnight followed by the sympathetic reaction to the RBNZ hold meeting yesterday, falling straight through the 65 cent level.
The Aussie has been under medium and long term pressure for sometime with the short term moves above the 65 level unable to set up for another breakout with short term momentum really painting the picture of internal weakness here. Watch for and signs of a new four hourly session low on reaction to a poor housing/retail sales print later today:
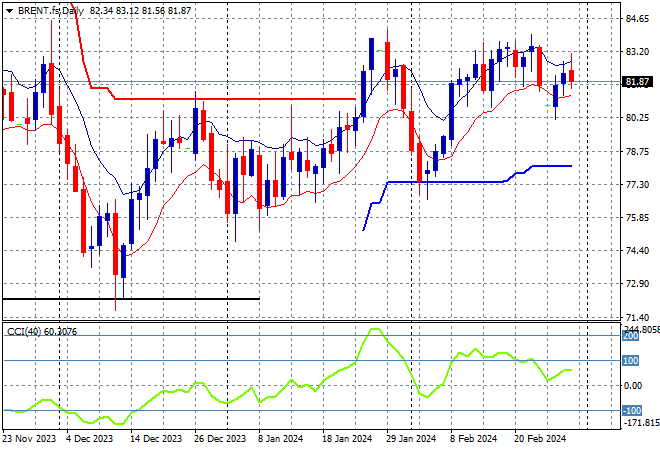
Oil markets are trying to regain their December highs with Brent crude not able to hold above the Friday night lows just below the $82USD per barrel level as it continues to reject the previous weekly high overnight.
After retracing down to trailing ATR daily support at the $77 level, price is still above the weekly resistance levels that so far have held from the January false breakout with the short term target the late January highs above $84 still the next target:
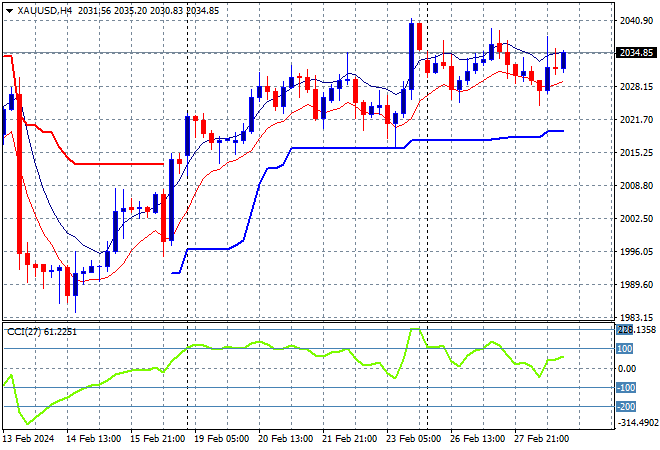
Gold is still trying to get out of its formerly depressed state following the US CPI print last week, able to just punch through the $2030USD per ounce level overnight and remain somewhat on trend.
Daily momentum is no longer overbought but still positive with short term support at the $2000 level the critical area to watch with a further session highs and a bounce above short term ATR resistance required to stay on trend:
Glossary of Acronyms and Technical Analysis Terms:
ATR: Average True Range – measures the degree of price volatility averaged over a time period
ATR Support/Resistance: a ratcheting mechanism that follows price below/above a trend, that if breached shows above average volatility
CCI: Commodity Channel Index: a momentum reading that calculates current price away from the statistical mean or “typical” price to indicate overbought (far above the mean) or oversold (far below the mean)
Low/High Moving Average: rolling mean of prices in this case, the low and high for the day/hour which creates a band around the actual price movement
FOMC: Federal Open Market Committee, monthly meeting of Federal Reserve regarding monetary policy (setting interest rates)
DOE: US Department of Energy
Uncle Point: or stop loss point, a level at which you’ve clearly been wrong on your position, so cry uncle and get out/wrong on your position, so cry uncle and get out!