
Wall Street is going it alone with a new record high for the S&P500 as it cracked the 5000 point level while European shares couldn’t find any confidence but futures are indicating that equities will rise higher on the open here in Asia this morning. The USD fell slightly while bond markets rose slightly after the US CPI revisions. The Australian dollar remains depressed amid ongoing USD strength but has pipped above the 65 cent level.
10 year Treasury yields nearly finished above the 4.2% level while oil prices continued to lift with Brent crude up 0.6% to stay above the $81USD per barrel level. Meanwhile gold is still under pressure as it barely holds on above the $2020USD per ounce level.
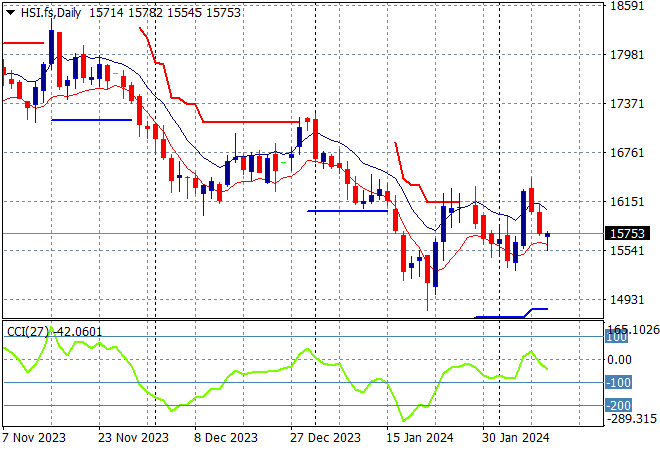
Looking at share markets in Asia from Friday’s session where mainland Chinese share markets were closed for the New Year holiday, and will do so all week while in Hong Kong the Hang Seng Index was still falling, off by nearly 0.9% to 15746 points.
The daily chart still shows the significant downtrend from the start of 2023 with the 19000 point support level a distant memory as medium term price action remains stuck below the 17000 point zone. Another rollover is now underway despite price bouncing off support at the 16000 point level as daily momentum was barely positive:
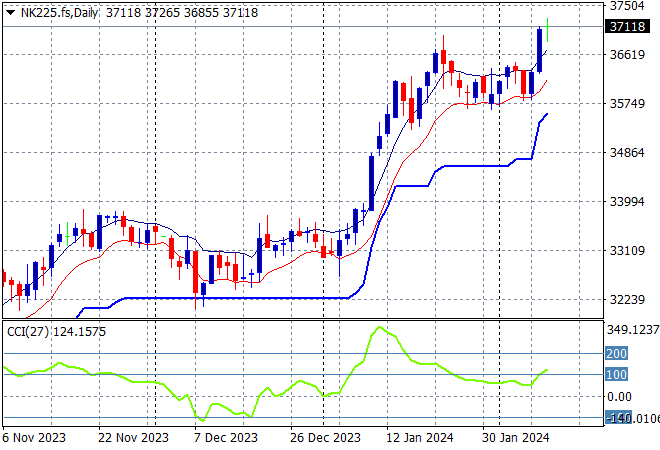
Japanese stock markets initially were able to get a wriggle on but struggled at the end with the Nikkei 225 closing just 0.1% higher at 36897 points, although futures are indicating a strong start this week.
Trailing ATR daily support was never threatened by price action after this bounce went beyond the September highs at the 33000 point level with daily momentum getting back to overbought readings with a significant breakout. A selloff back to ATR support at 32000 points remains unlikely as the November highs are wiped out in this breakout but I’m cautious of a strong pullback here on any volatility:
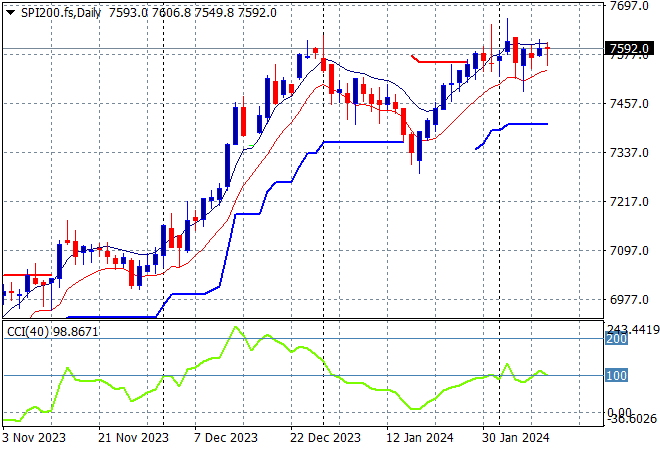
Australian stocks also tried hard to finish on a positive note with the ASX200 up just 0.1% at 7644 points.
SPI futures are dead flat despite the strong sessions on Wall Street from Friday night. The daily chart is looking firmer with the medium term uptrend and short term price action coming together to take out the previous December highs. I would still watch for any continued dip below the low moving average and conversely with a breakout above the 7600 point level:
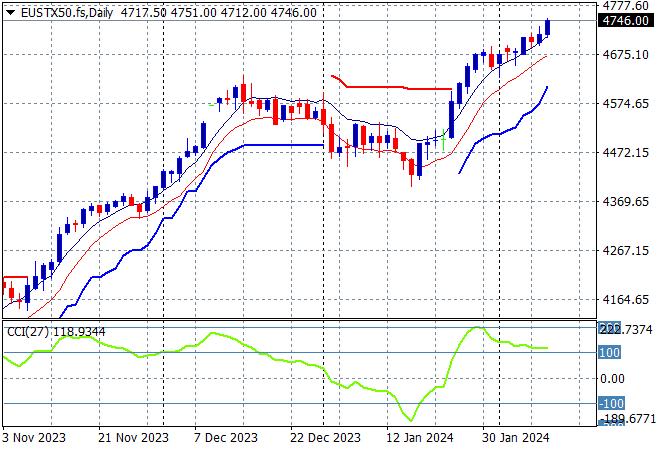
European markets were unable to bounce back on Friday night with small losses across the continent with the Eurostoxx 50 Index eventually finishing just 0.1% higher at 4715 points.
The daily chart however shows price action still on trend after breaching the early December 4600 point highs with daily momentum still well overbought with futures indicating a stronger open this evening. There are some hopeful signs this could turn into a larger breakout overall:
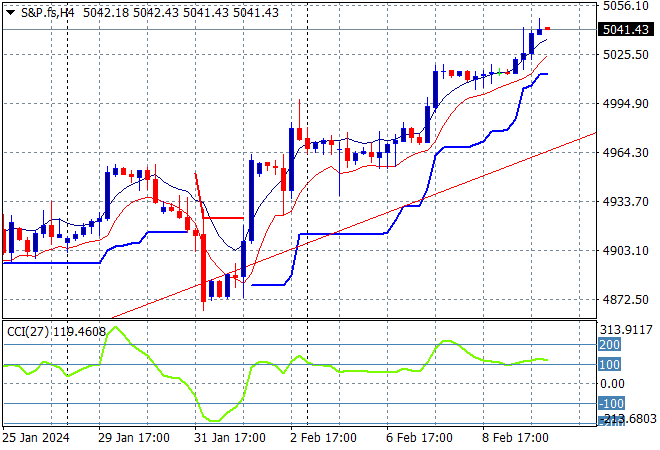
Wall Street were the most positive again with the NASDAQ advancing more than 1% while the S&P500 pushed through the magical 5000 point level to close 0.5% higher at 5026 points.
Short term momentum has retraced fully out of oversold territory on the four hourly and daily chart, now getting nicely overbought as the 5000 point level becomes support going forward, despite the “good” economic roadblocks due to the stronger NFP and USD:
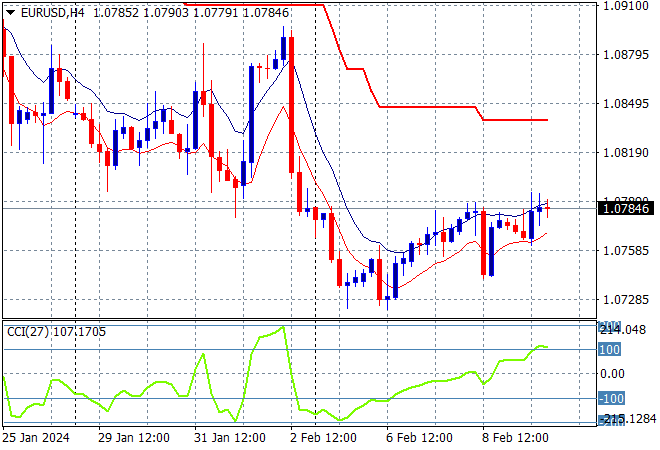
Currency markets saw another mild pullback against USD with Euro slowly regaining strength after being on the floor following last week’s NFP print, but is still struggling to get above the 1.08 handle.
The union currency had been climbing slowly all week after the big reaction that saw it drop to a new weekly low almost below the 1.07 level and is not yet out of the woods. Short term momentum has now switched to slightly overbought but price action is well contained below trailing ATR resistance. Watch for a larger retracement if the 1.0720 area is broken:
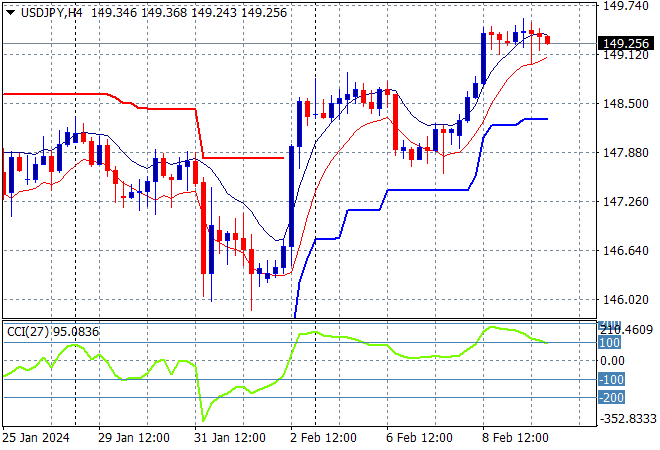
The USDJPY pair was able to stabilise again after a staid previous session following a surge through the 149 handle, holding at a new weekly high.
This is looking very optimistic as Yen sells off due to BOJ meanderings but I’m wary of a pullback to the recent highs at the mid 148 level, so watch any inversion in short term momentum carefully:
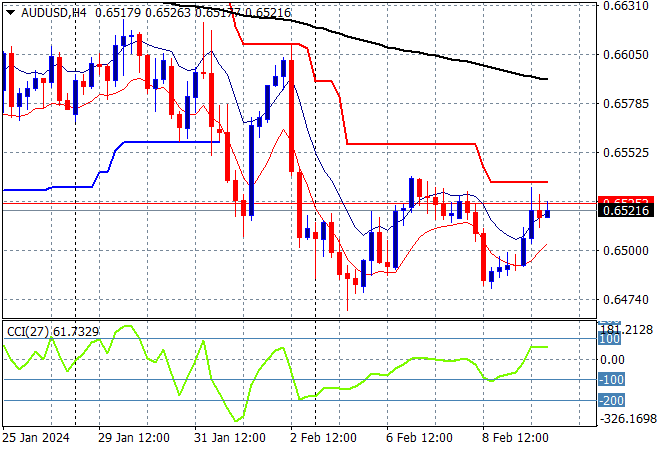
The Australian dollar remains one of the weakest undollars although it did manage a last minute reprieve on Friday night after threatening to finish the trading week below the 65 handle following a lack of confidence after the recent RBA meeting.
The Aussie has been under medium and long term pressure for sometime with the latest rally just a relief valve being let off before this realignment back to a strong USD. There are some signs of deceleration here so watch the 65 level for a possible inversion above trailing ATR resistance:
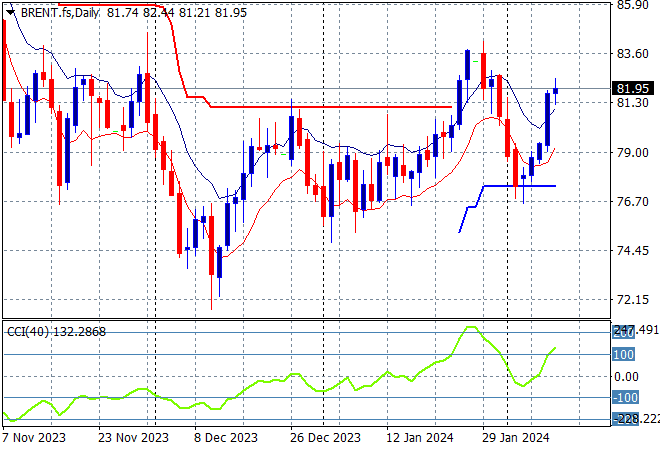
Oil markets have been able to stabilise and then launch higher with a solid breakout in the previous session confirmed with Brent crude almost lifting above the $82USD per barrel level on Friday night.
After retracing down to trailing ATR daily support at the $77 level, price is now back above the weekly resistance levels that so far have held from the January false breakout with the short term target the late January highs above $84 next:
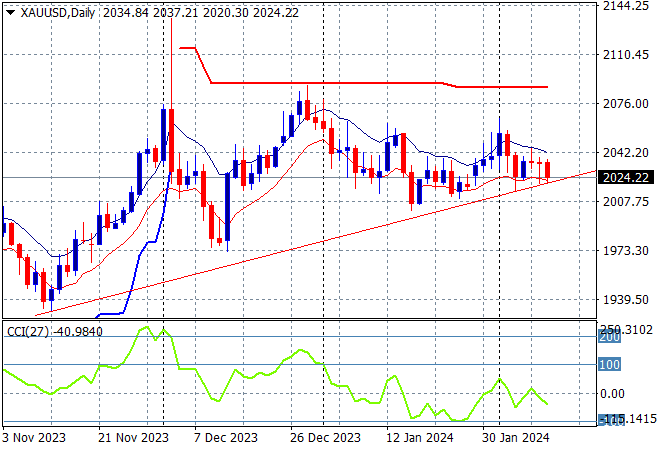
Gold remains a bit wobbly after its short term rally following the FOMC and BOE meetings, managing to barely hold above the $2020USD per ounce level on Friday night as it completes an ascending triangle pattern on the daily chart.
Daily momentum is still in a negative mood and short term support at just above the $2000 level will likely come under threat next here if the USD gains further strength, so watch for break below the triangle line:
Glossary of Acronyms and Technical Analysis Terms:
ATR: Average True Range – measures the degree of price volatility averaged over a time period
ATR Support/Resistance: a ratcheting mechanism that follows price below/above a trend, that if breached shows above average volatility
CCI: Commodity Channel Index: a momentum reading that calculates current price away from the statistical mean or “typical” price to indicate overbought (far above the mean) or oversold (far below the mean)
Low/High Moving Average: rolling mean of prices in this case, the low and high for the day/hour which creates a band around the actual price movement
FOMC: Federal Open Market Committee, monthly meeting of Federal Reserve regarding monetary policy (setting interest rates)
DOE: US Department of Energy
Uncle Point: or stop loss point, a level at which you’ve clearly been wrong on your position, so cry uncle and get out/wrong on your position, so cry uncle and get out!