CBA analysis of the Stage 3 tax cuts revealed the extent to which Australian workers are being penalised by rising personal income taxes.
As seen in the following chart, the amount of income tax payable increased by a whopping 23.4% in the year to September 2023 (latest available data).
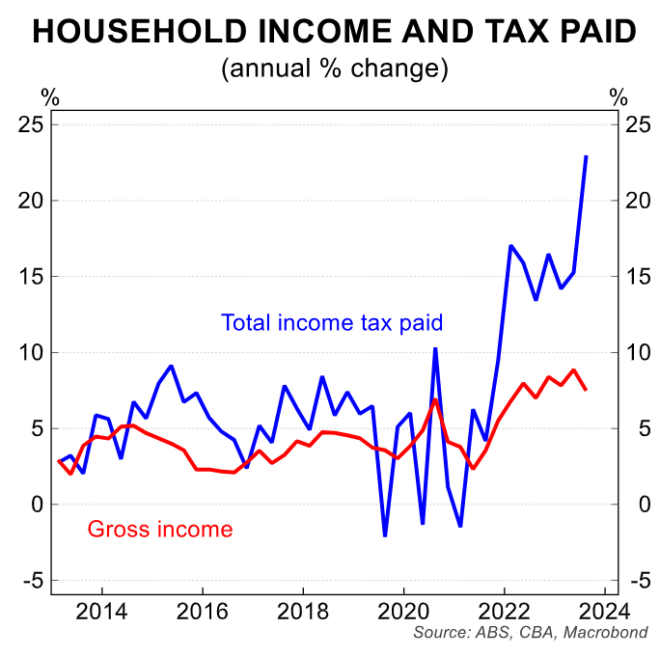
However, over the same period, overall gross household income increased by a significantly smaller 7.5%.
The disparity between tax paid and earnings meant that the share of aggregate household income lost to personal taxes surged to an equal record high in September 2023.
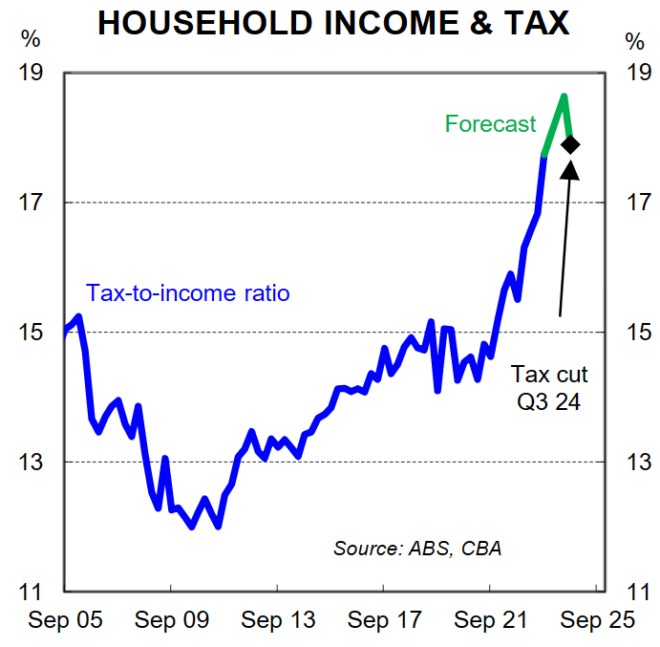
Worse, even after the Stage 3 tax cuts, the CBA predicts that the share of income lost to personal taxes will be higher in Q3 2024 and will continue to climb as inflation pushes people into higher tax rates (known as “bracket creep”).
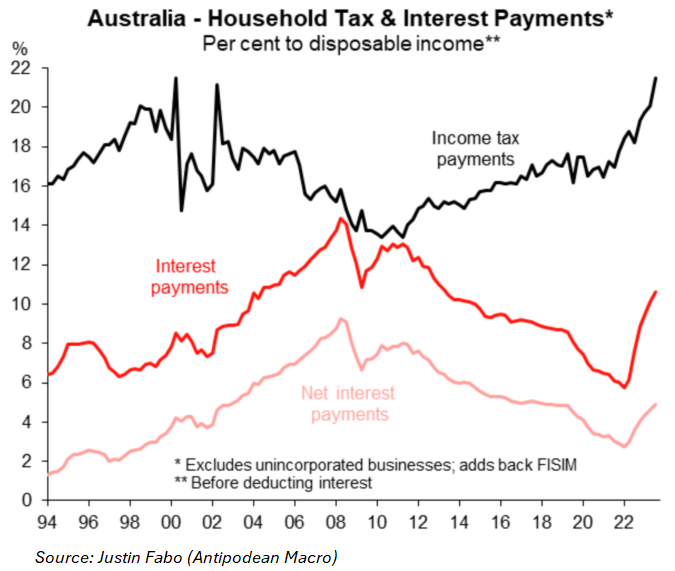
The surge in income taxes has occurred amid soaring mortgage repayments and rents, which have conspired to pound working households.
The latest cost of living indices from the Australian Bureau of Statistics (ABS) showed that employee households had a 6.9% increase in their cost of living in 2023, far exceeding the CPI inflation rate of 4.1%:
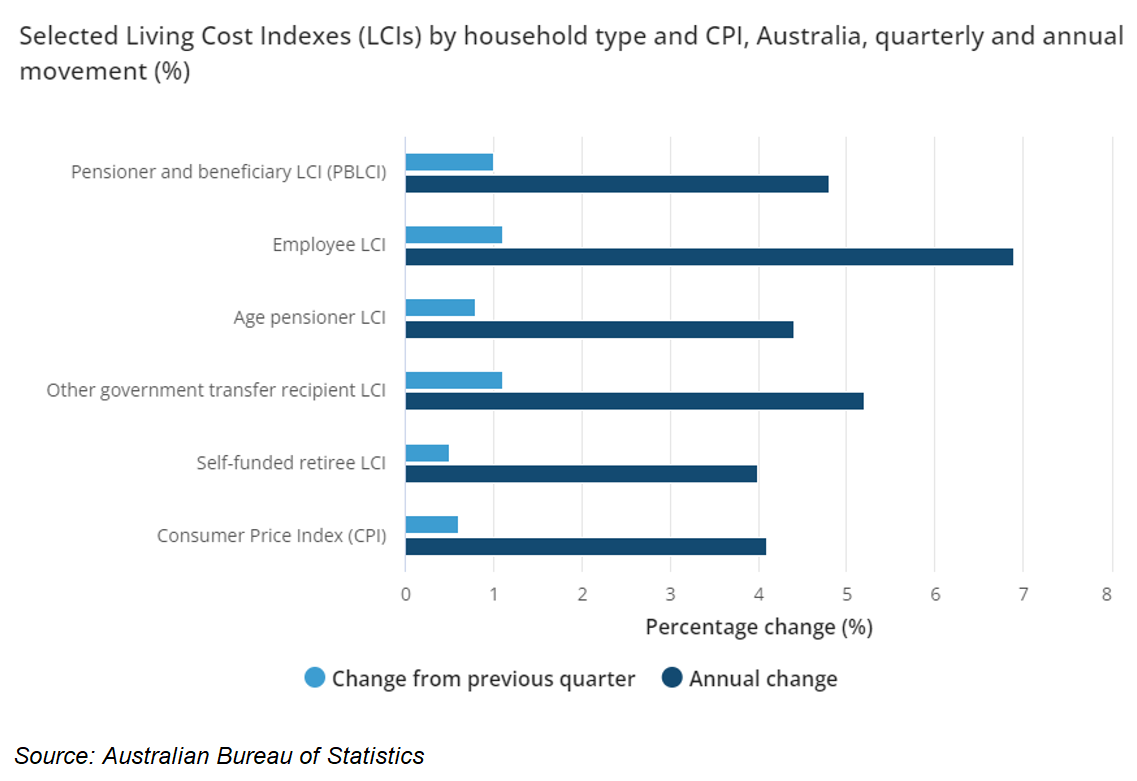
Self-funded households, on the other hand, saw a slightly lower increase in living costs than CPI inflation.
The ABS attributed the disproportionate increase in employee cost of living to mortgage interest payments, which increased by more than 40% over the year and “makes up a higher proportion of expenditure for employee households”.
Soaring mortgage and rental payments, combined with increased personal income taxes, contributed to a record 6% fall in real household disposable earnings in the fiscal year ending September 2023.
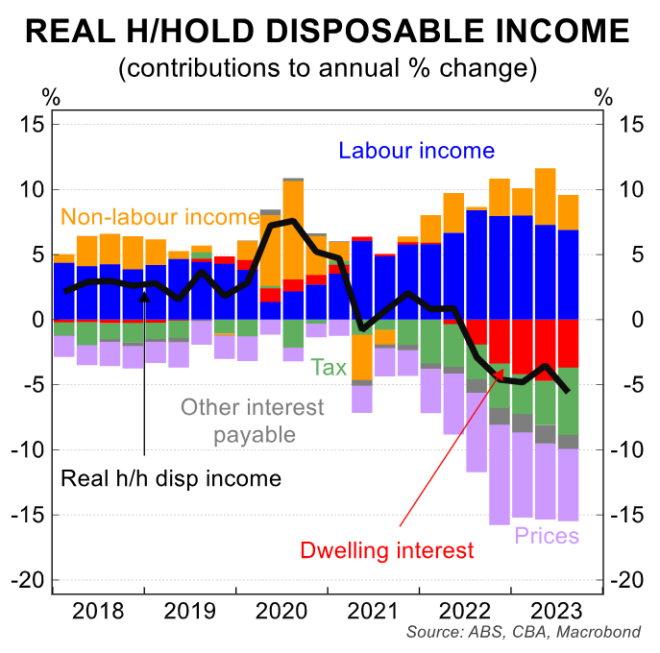
The main exception is home-owning retirees, who have been shielded from rising mortgage payments, rents, and personal income taxes.
These seniors also acquired an astounding $160 billion war chest of savings throughout the pandemic, thanks to the government’s various stimulus measures, as well as restricted consumption during lockdown periods.
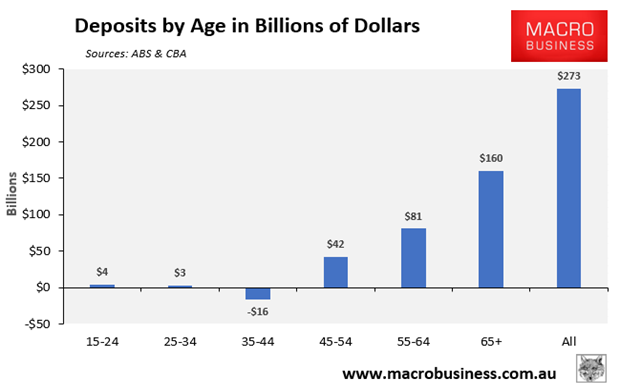
Younger Australians under the age of 45, on the other hand, saw their savings fall, with households in the critical home-buying and child-rearing demographic of 35 to 44 being the hardest hit.
Baby Boomer retirees have the highest rate of property ownership in the country (most without a mortgage), and they have seen the greatest increase in wealth since the pandemic began.
According to Roy Morgan’s Wealth Report 2023, Australia’s wealth increased by 7.0% between March 2020 (before COVID) and March 2023.
The value of owner-occupied homes rose by 43.2%, from $4.16 trillion to $5.95 trillion, which was the main factor in this wealth increase.
Half of the population, predominantly homeowners, account for 95.4% of Australia’s net wealth.
The lowest half of the population – largely renters – also saw their wealth share improve, but only from 3.6% to 4.6%.
There are three Australias:
The Reserve Bank of Australia’s 4.35% interest rate hikes have a direct impact on roughly one-third of owner-occupier mortgage-holding households, particularly Generation Xers and Millennials with small children.
They have seen their mortgage repayments increase by more than 50%, while their disposable incomes have fallen at the quickest rate on record due to inflation and rising costs of living.
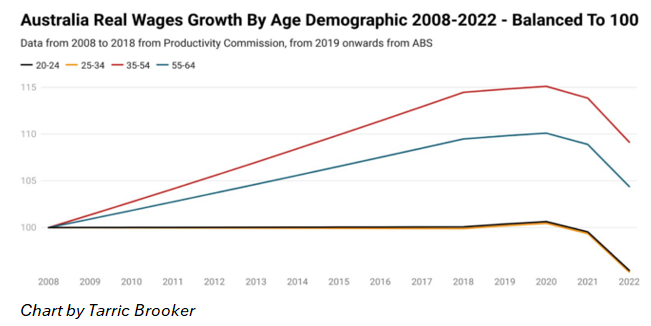
Australians under 35 earn less in actual terms than they did in 2008.
Rising rents and declining real incomes are crushing another one-third of renting households, who are primarily young.
The older generations, headed by the baby boomers, are on the other end of the spectrum.
They usually own their homes outright, so rising mortgage rates and rent hikes have little impact on them.
Some baby boomers are even profiting from rising rents, as they own a large proportion of the country’s investment properties (many of which are mortgage-free).
Most do not work; therefore, they are untouched by the increase in income taxes and bracket creep.
Australians receiving the old age pension also have their payments tied to inflation (unlike workers’ earnings), therefore their purchasing power was maintained while prices grew.
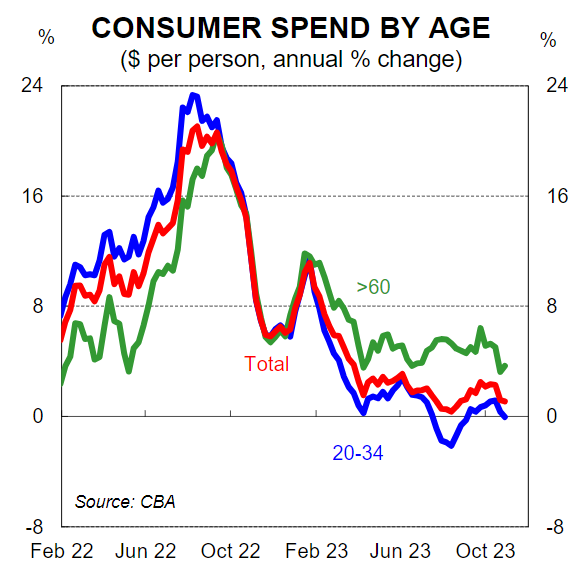
A survey of seven million CBA customers’ purchasing habits found that Australians aged 70 and above spent more than CPI inflation in September 2023:
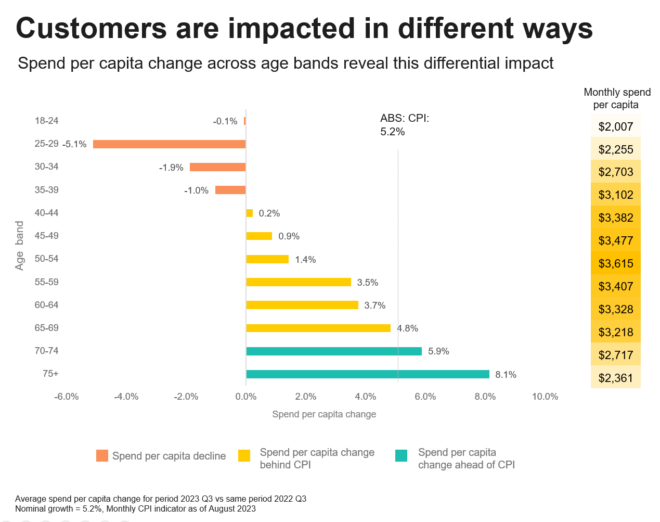
Younger Australians under 40, on the other hand, reduced their spending in absolute terms, whilst Australians aged 40 to 69 spent less than CPI inflation, with expenditure falling faster as the household age grew younger.
Australia urgently needs broad-based tax reform:
The figures shown above demonstrate why Australia urgently requires tax reform that shifts the base away from productive activity (taxing work) and towards more efficient sources such as resources, land, and consumption.
Australia’s tax system is unsustainable, wasteful, and inequitable since it is so reliant on a diminishing pool of workers while the proportion of taxes collected via indirect sources (e.g., GST and fuel excise) declines.
This is especially true given that the older population is expanding and paying lower taxes than ever before, despite controlling the majority of the country’s wealth.
