
CoreLogic has released its daily dwelling value results for February, which track movements across the five major capital city markets.
According to CoreLogic, dwelling values rose by 0.6% at the 5-city aggregate level in February, with growth recorded across every major capital:
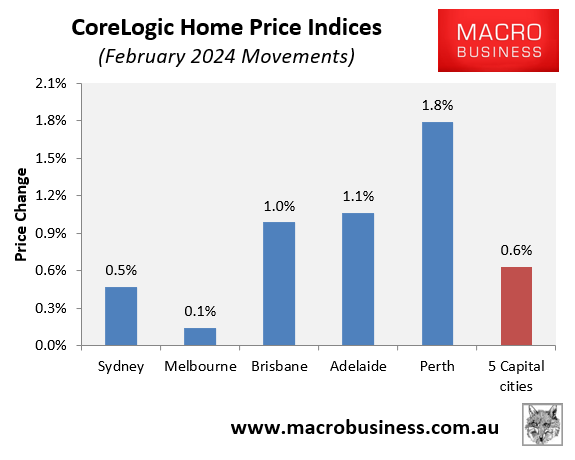
As you can see, growth was driven by Perth (1.8%), Adelaide (1.1%), and Brisbane (1.0%), whereas Sydney (0.5%) and Melbourne (0.1%) recorded slower growth in February.
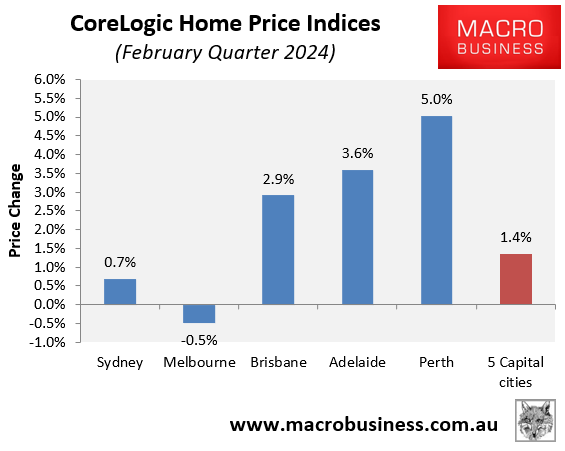
Over the quarter, dwelling values rose by 1.4% at the 5-city aggregate level, again driven by Perth (5.0%), Adelaide (3.6%), and Brisbane (2.9%).
By comparison, values rose by only 0.7% across Sydney over the quarter, and fell by 0.5% across Melbourne:
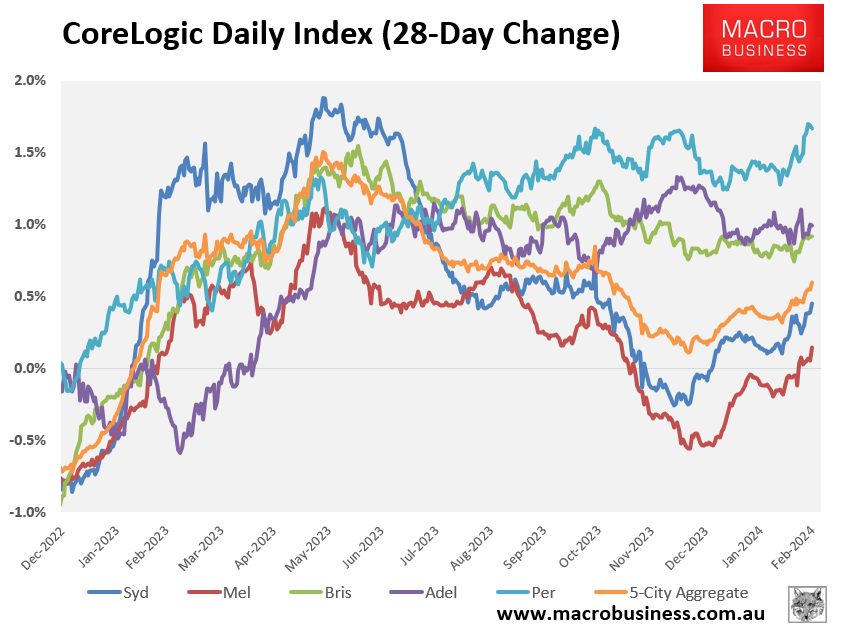
The next chart plots 28-day value growth across the five major markets. You can see the clear strengthening in growth rates in February:
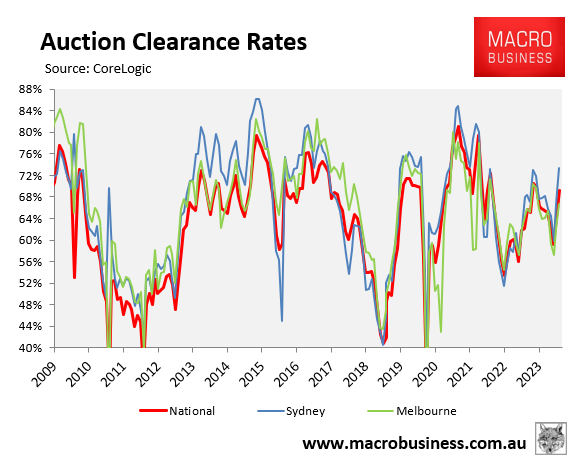
This is also reflected in auction clearance rates, which have rebounded in 2024:
Finally, dwelling values have rebounded by 11.1% from their January 29, 2023, low at the 5-city aggregate level:
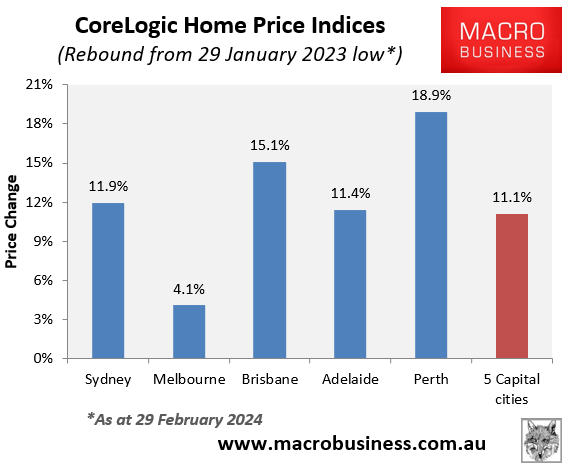
All major markets other than Melbourne have recorded double-digit rebounds, with Perth and Brisbane leading the way.
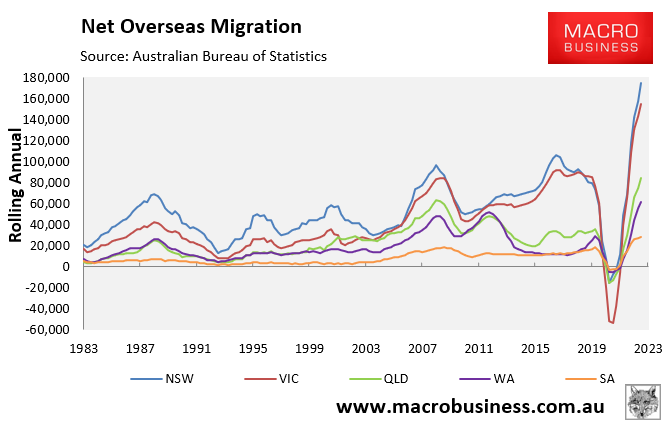
The record surge in net overseas migration continues to drive values higher, despite the strong lift in mortgage rates.
