PropTrack has released some stunning charts showing that Australia’s median housing affordability is the worst in at least 30 years:
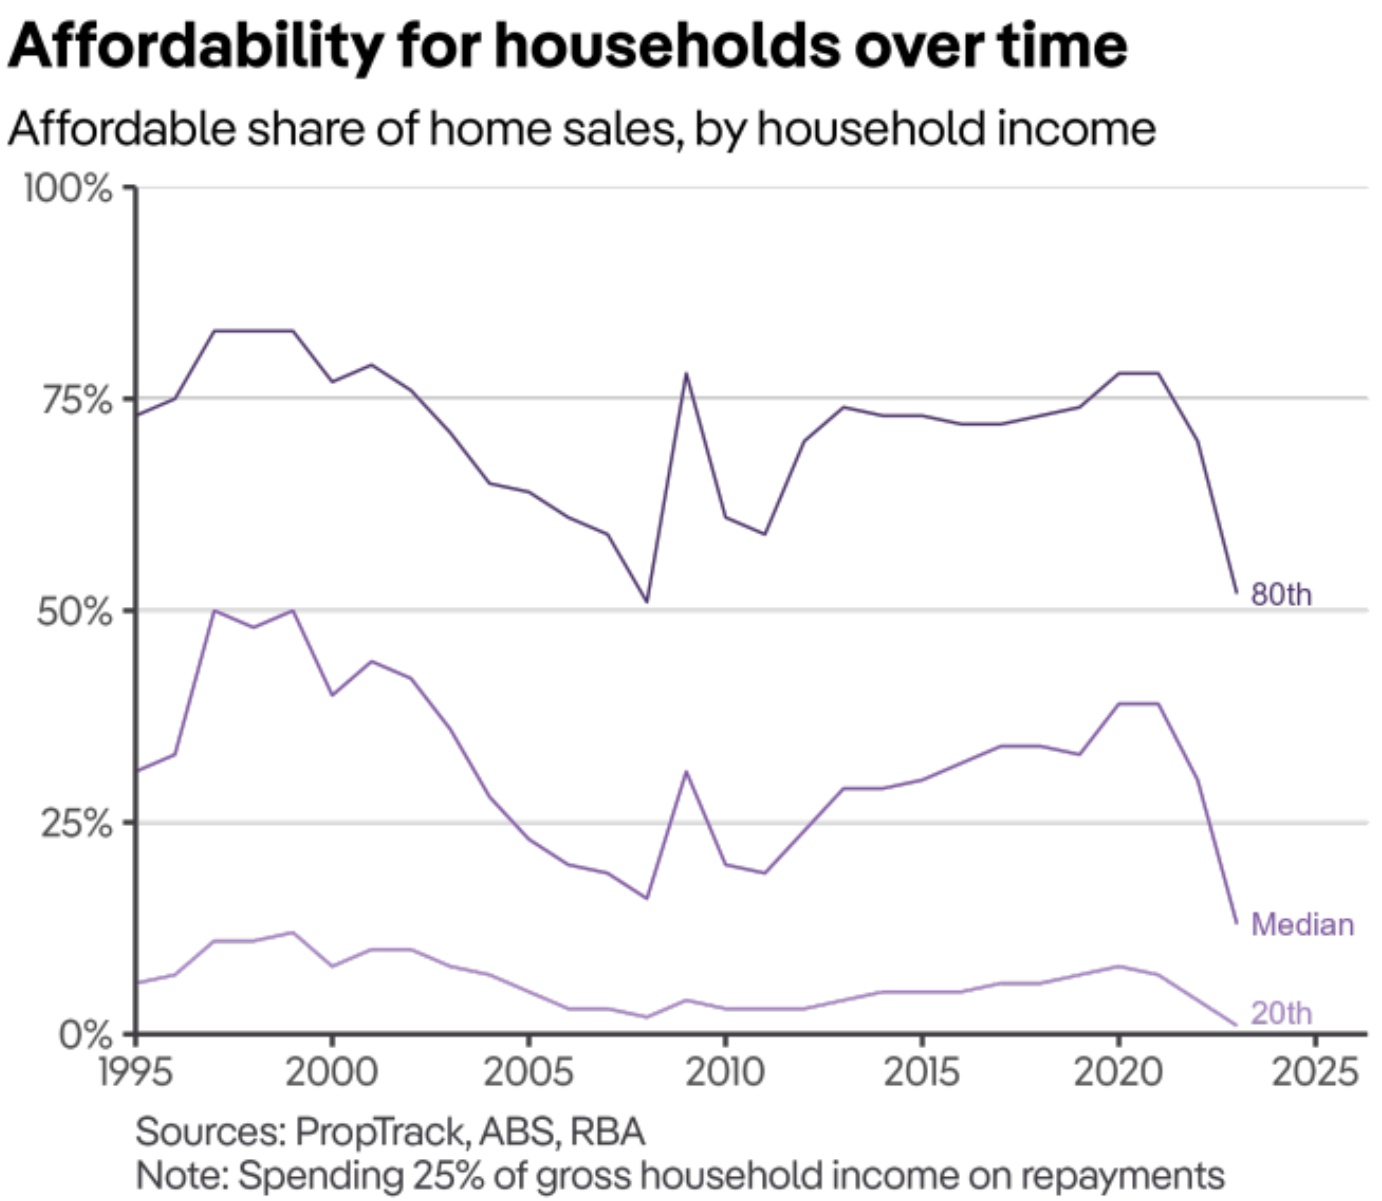
As shown above, the decline in affordability is broad-based, impacting both higher and lower-income earners.
The next chart from PropTrack also shows that a median household in Australia can only afford 13% of homes sold – an extraordinary low share:
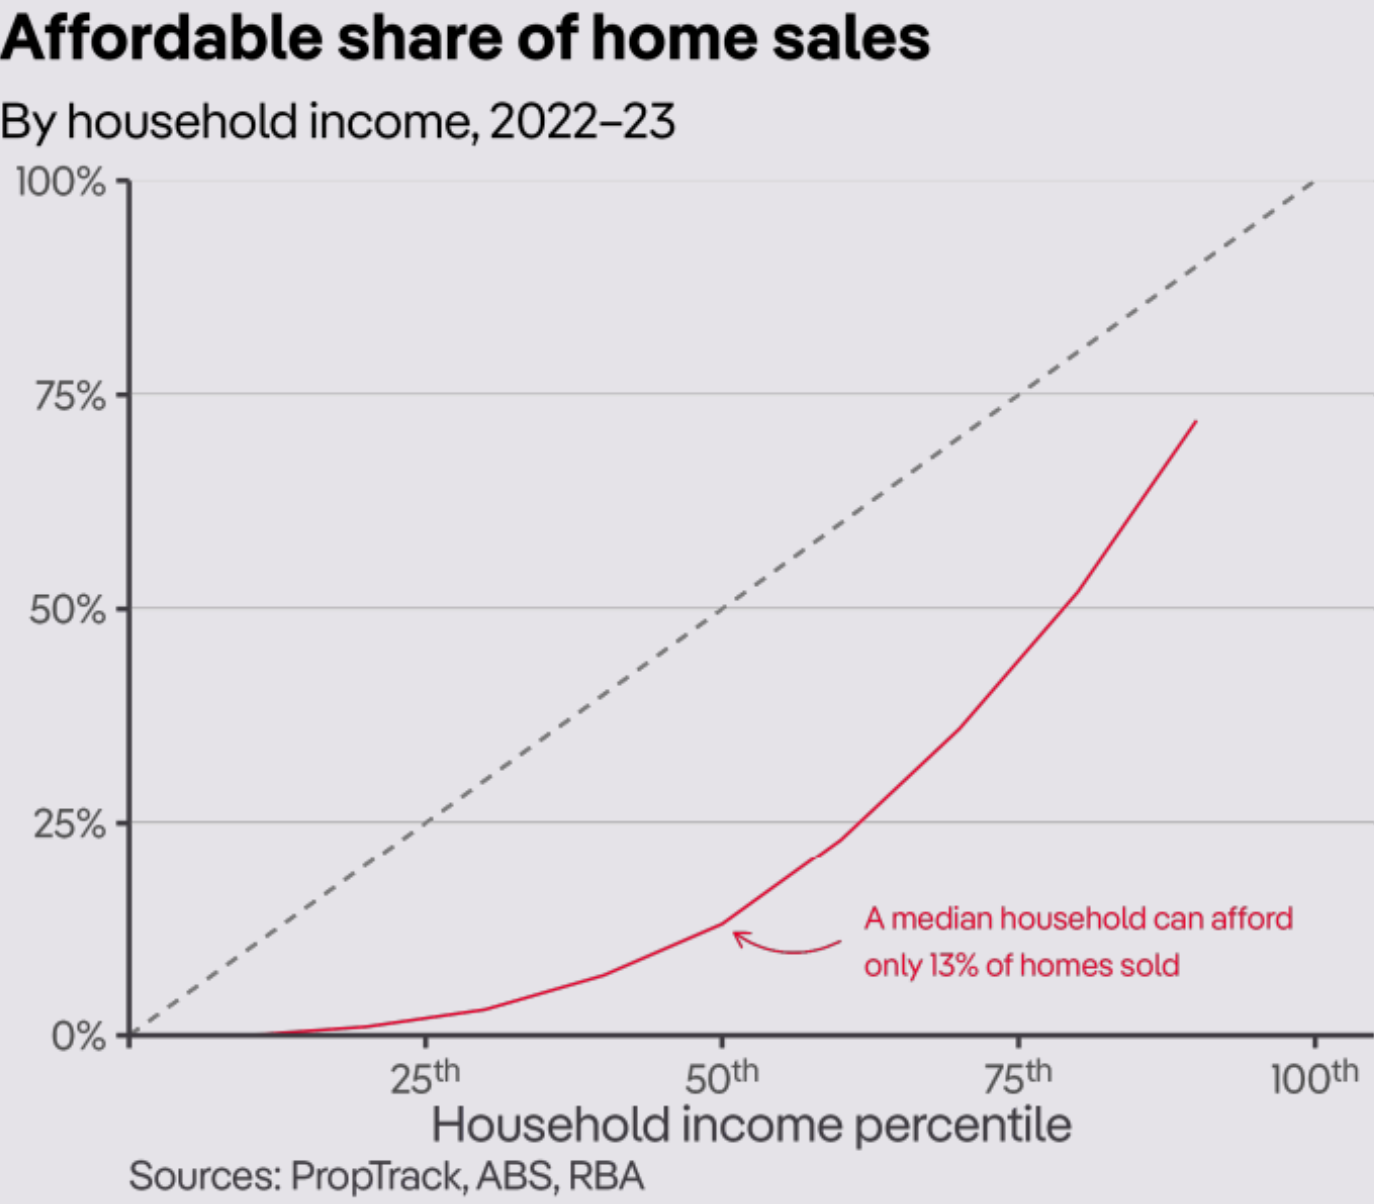
The situation was nicely summed up by independent economist Tarric Brooker on Twitter (X):
“The median household can only afford a home in the 13th percentile today, compared with the 50th in 1999”.
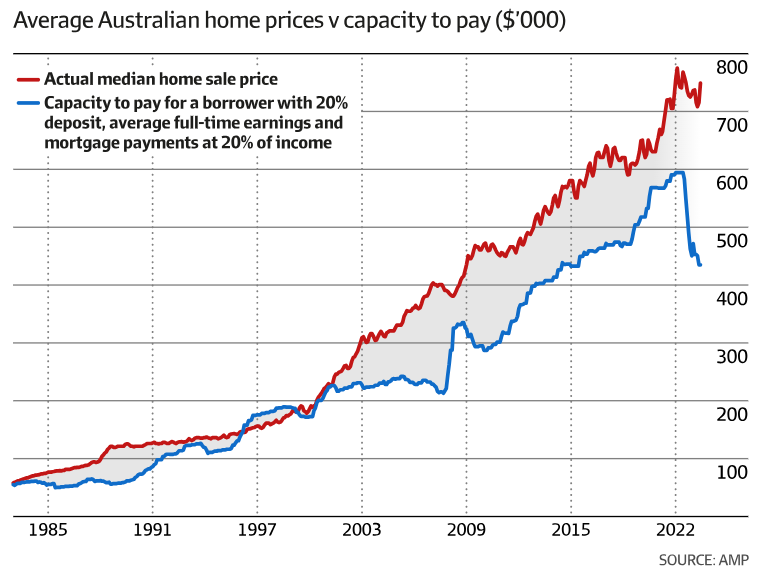
“Even people with high incomes are now competing for median-priced homes”.
This data accords with recent analysis from Shane Oliver at AMP (published in The AFR), which shows the record gap between median home prices and capacity to borrow:
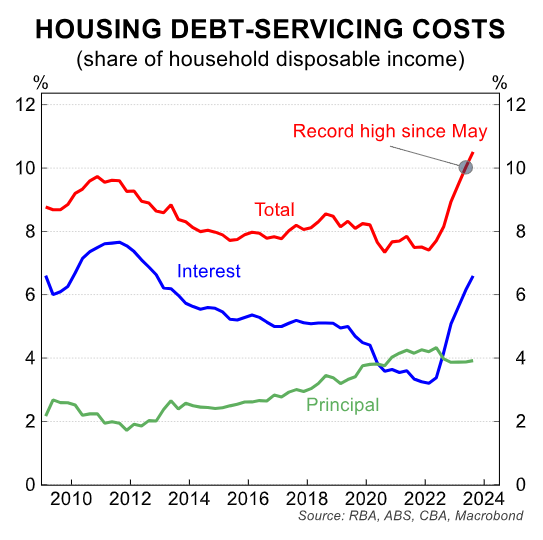
This reflects the combination of higher home prices and soaring mortgage repayments:
The data is another shocker that highlights the monumental failure of Australian housing policy.
