
Strong economic data out of the US kept risk sentiment in check on Friday night as the USD also remained buoyed despite some early runs from the major pairs including Euro and Aussie. Wall Street managed another scratch session while European shares rallied across the continent. The Australian dollar still couldn’t managed a break above the 66 cent level.
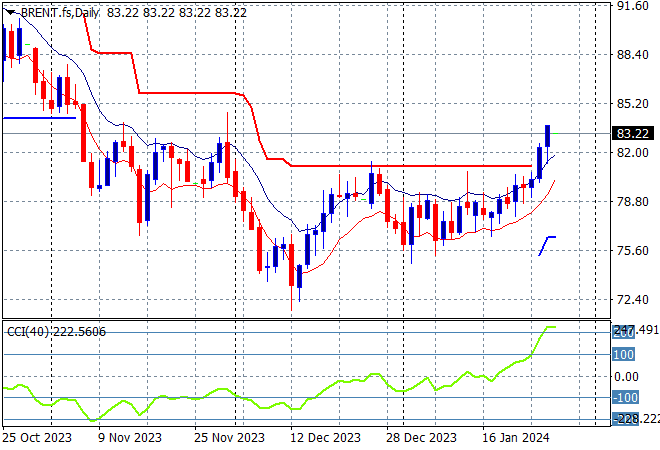
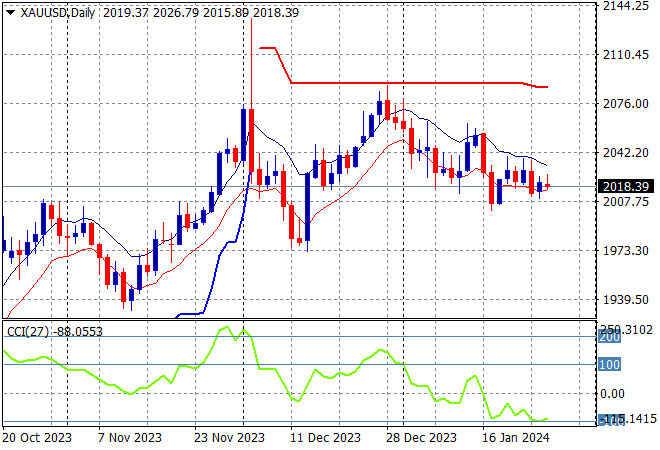
10 year Treasury yields were up again to get back above the 4.1% level with chances of a March rate cut starting to firm while February is baked in with no change. Oil prices rallied with Brent crude lifting above the $83USD per barrel level while gold couldn’t hold on to its recent gains with a flop back down to the $2018USD per ounce level.
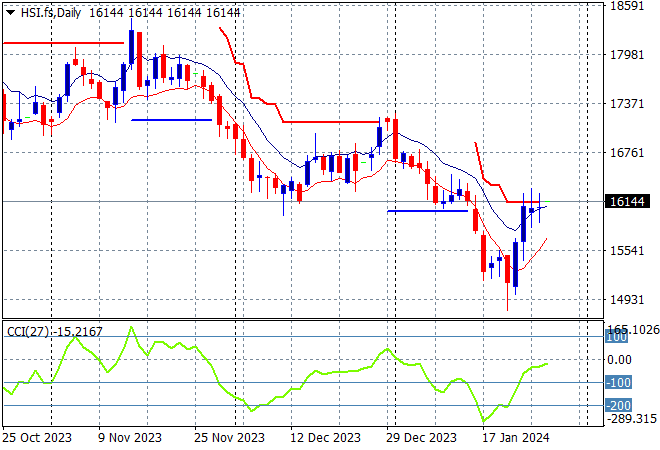
Looking at share markets in Asia from Friday’s session where mainland Chinese share markets were largely unchanged as the Shanghai Composite lifted just 0.1% to 2910 points while in Hong Kong the Hang Seng Index sold off sharply, down 1.6% to 15952 points.
The daily chart still shows the significant downtrend from the start of 2023 with the 19000 point support level a distant memory as medium term price action remains stuck below the 17000 point zone. However this recent bounce is seeing daily momentum readings almost reach positive settings as the previous session bullish engulfing candle lit up a strong rebound that could have legs here as part of a new swing trade to reach former support at the 16000 point level:
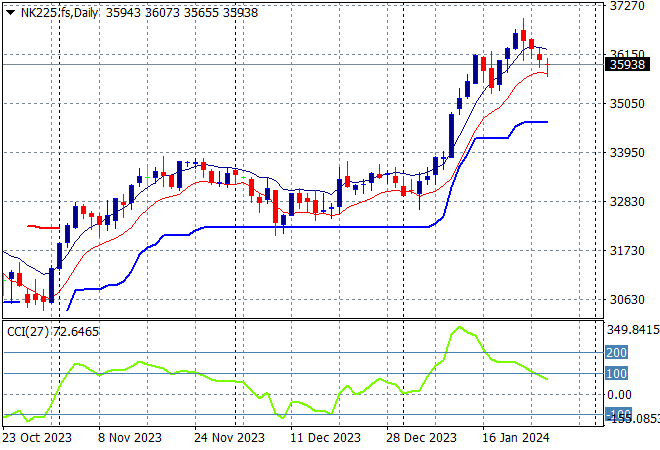
Japanese stock markets were also in the doldrums with the Nikkei 225 closing nearly 1.4% lower at 35751 points.
Trailing ATR daily support was being threatened by price action after this bounce went beyond the September highs at the 33000 point level with daily momentum remaining extremely overbought. Correlations with a stronger Yen are breaking down here with a selloff back to ATR support at 32000 points unlikely as the November highs are wiped out in this breakout but I’m cautious of a strong pullback here on any volatility:
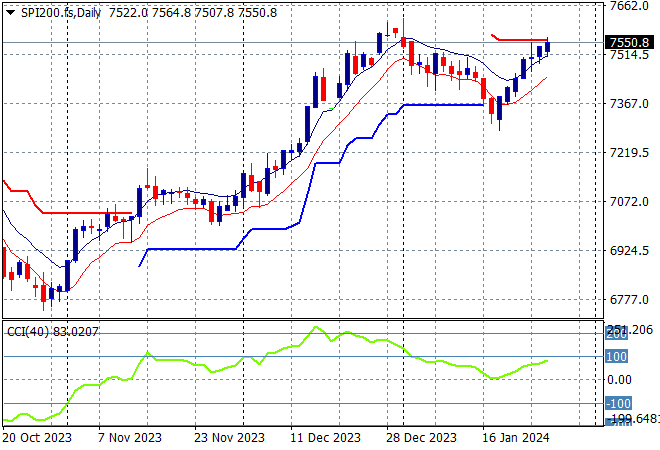
Australian stocks were the only bright spark as the ASX200 closed nearly 0.5% higher at 7555 points, after earlier absorbing the impact of the latest tax cut news.
SPI futures are up 0.2% or so despite the wobbly result on Wall Street from Friday night. The daily chart is still looking somewhat mixed here despite the medium term uptrend with short term price action however looking to take out the previous December highs. I would still watch for any continued dip below the low moving average and conversely with a breakout above the 7600 point level:
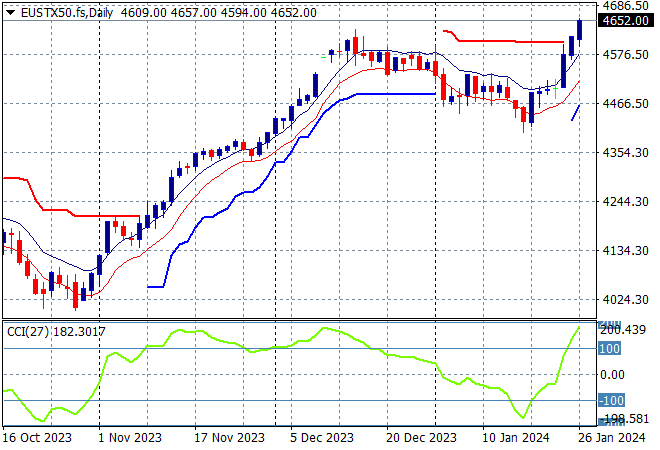
European markets found more confidence with a new three day rally following the ECB meeting as the Eurostoxx 50 Index finished more than 1.1% higher at 4635 points.
The daily chart was showing price action meandering and not yet making a solid attempt at breaching the early December 4600 point highs before this surge with daily momentum now well overbought and price exceeding the highs from December:
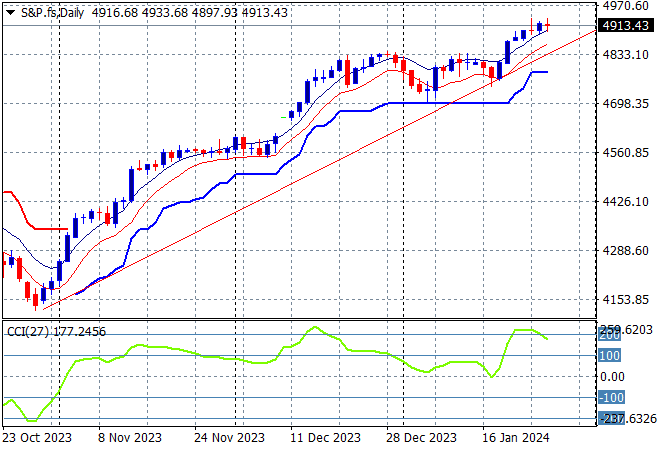
Wall Street tried to climb throughout the session but couldn’t hold on to all the gains with the NASDAQ pushed down 0.4% while the S&P500 lost three points to close the week out at 4890 points.
Short term momentum has slightly retraced from extended overbought territory on the four hourly and daily chart, with this solid breakout taking out trailing ATR resistance and the weekly highs overhead. Overall support has been strong at the 4700 point level proper but with those December highs as very strong resistance now breached we could see a swift run up to 5000 points:
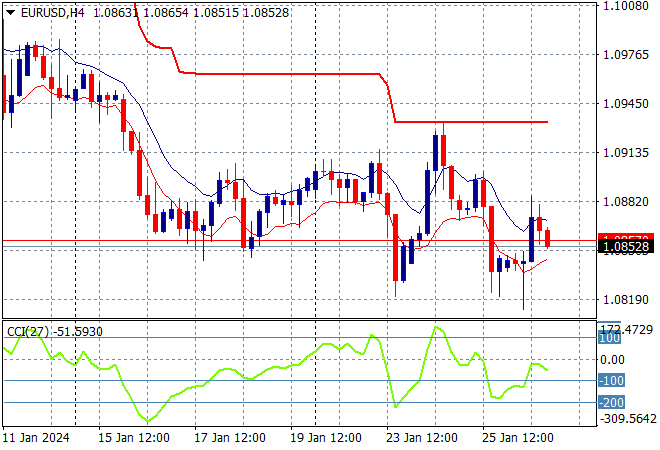
Currency markets increased in volatility as traders absorbed the latest US domestic data with the usual push and pull against King Dollar that eventually saw Euro pulled back to a new weekly low at the mid 1.08 level.
The union currency is still looking weak here after tracking sideways for nearly three weeks as short term momentum switched to negative as price action remains contained well below trailing ATR resistance. After being considerably oversold there was potential building for a swing trade higher, but the break below the low moving average has seen a new weekly low:
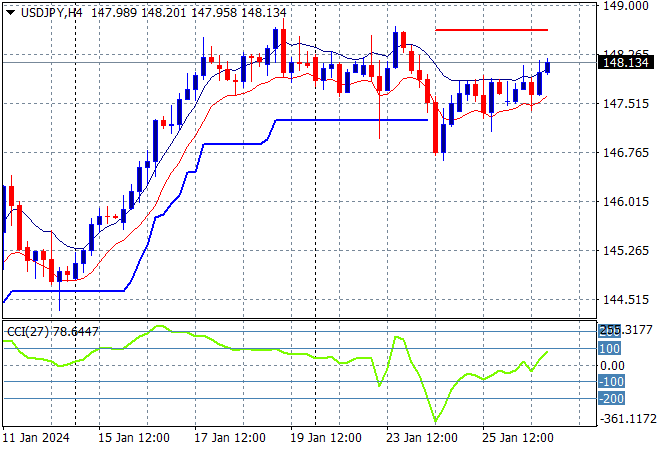
The USDJPY pair remains in a sideways bullish/consolidating mood after its recent big surge to the 148 level with a small uptick at the end of the session on Friday night.
Four hourly momentum has calmly retraced from being extremely overbought with price firming and support building at the 147 handle below:
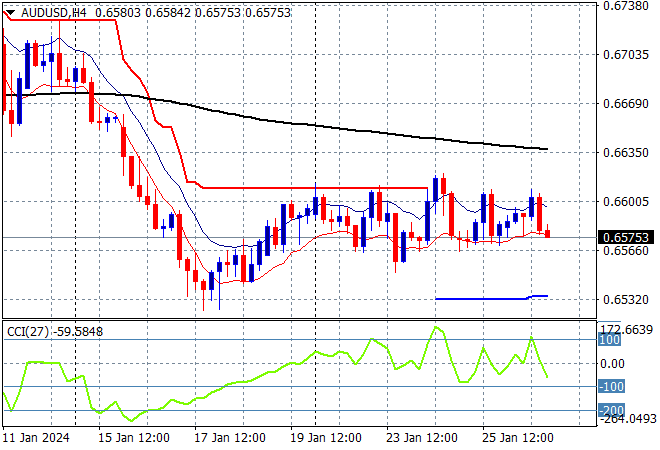
The Australian dollar is still the weakest undollar as traders await the February RBA meeting with another weak session on Friday night keeping it well below the 66 level with short term resistance just too strong for now.
The Aussie has been under medium and long term pressure for sometime with the latest rally just a relief valve being let off with short term momentum returning to oversold territory as traders still have another month for the RBA to come back from holidays. As I said previously, if you’d turn this chart upside down and you’d be bullish – but watch trailing ATR resistance in the short term:
Oil markets saw a proper breakout that had been building mid week with the usual low volatility begetting higher volatility with Brent crude breaching the $83USD per barrel level on Friday as tensions mount in the Middle East.
After clearing a key resistance level, and daily momentum now well out of negative settings this is setting up for a potential swing higher so watch carefully for a bigger breakout:
Gold has been looking weak after the weekend gap with the inability to clear short term resistance at the $2030USD per ounce level with a continued breakdown all week sending it back to the $2010 level.
Watch for a potential return to the previous lows just above the $2000USD per ounce level next as short term momentum becomes oversold going into tonight’s session:
Glossary of Acronyms and Technical Analysis Terms:
ATR: Average True Range – measures the degree of price volatility averaged over a time period
ATR Support/Resistance: a ratcheting mechanism that follows price below/above a trend, that if breached shows above average volatility
CCI: Commodity Channel Index: a momentum reading that calculates current price away from the statistical mean or “typical” price to indicate overbought (far above the mean) or oversold (far below the mean)
Low/High Moving Average: rolling mean of prices in this case, the low and high for the day/hour which creates a band around the actual price movement
FOMC: Federal Open Market Committee, monthly meeting of Federal Reserve regarding monetary policy (setting interest rates)
DOE: US Department of Energy
Uncle Point: or stop loss point, a level at which you’ve clearly been wrong on your position, so cry uncle and get out!wrong on your position, so cry uncle and get out!