
It was all about bond markets overnight with UK gilts and US Treasury yields falling sharply as stock markets continued their wobbles going into the end of year session. The USD rebounded against the majors with the Australian dollar pulling back further from its five month high after the RBA held yesterday, falling to the mid 65 cent level while Euro continued its selloff with another new weekly low below the 1.08 level.
10 year Treasury yields saw another near 10 point drop to just below the 4.2% level while oil prices remain volatile with Brent crude pushed towards the $77USD per barrel level. Gold’s blowout on the Monday morning open was further pulled back but consolidation is starting to happen around the $2020USD per ounce level.
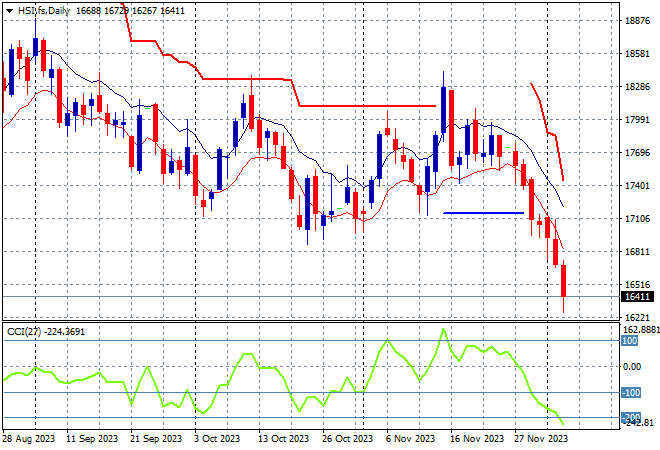
Looking at share markets in Asia from yesterday’s session where mainland Chinese share markets had steep falls with the Shanghai Composite down over 1.6% to 2972 points while in Hong Kong the Hang Seng Index went down nearly 2% to acceleraate its losing streak, closing at 16327 points.
The daily chart was showing a significant downtrend that had gone below the May/June lows with the 19000 point support level a distant memory as medium term price action remained stuck in the 17000 point range before this new losing streak. Daily momentum readings are solidly back to oversold settings with price action now below the October lows:
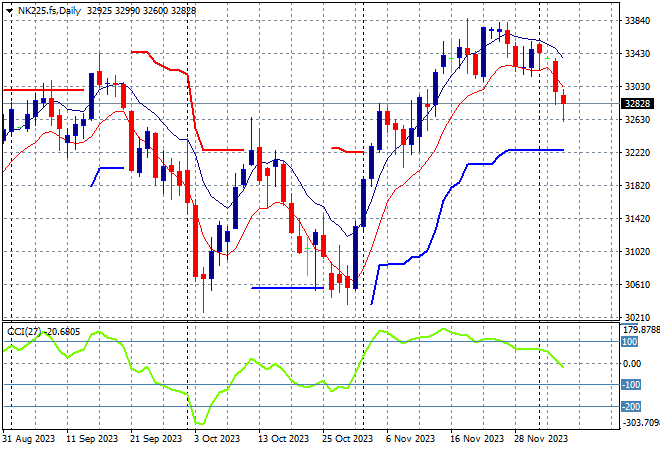
Japanese stock markets also sold off with the Nikkei 225 down 1.3% to 32775 points to make a substantive new weekly low.
Trailing ATR daily support is starting to come up to price action after this bounce went beyond the September highs at the 33000 point level with daily momentum now fully retracing from the overbought zone. Correlations with Wall Street and Yen are in play again with this stall possibly turning into a selloff back to ATR support at 32000 points:
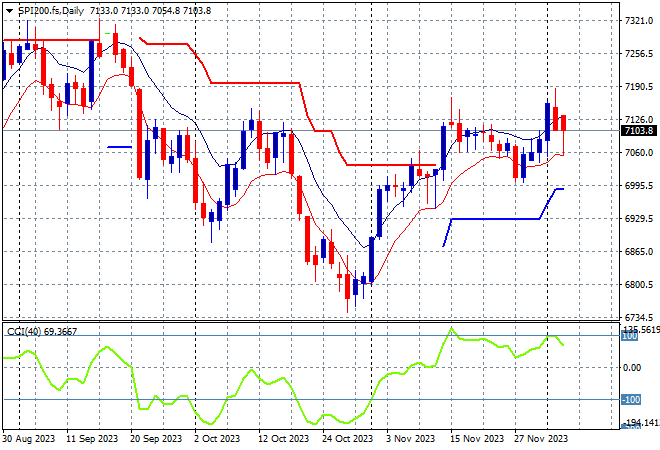
Australian stocks played catchup of sorts after the RBA hold, with the ASX200 closing 0.9% lower at 7061 points, still holding above key support at the 7100 point level.
SPI futures however are indicating a 0.4% lift on the open, despite the wobbles on Wall Street overnight. The daily chart is again looking more optimistic here in the medium term with short term price action filling a hole against the tide and firming somewhat here with a possible reverse head and shoulders pattern forming, but resistance at 7200 points is looming overhead:
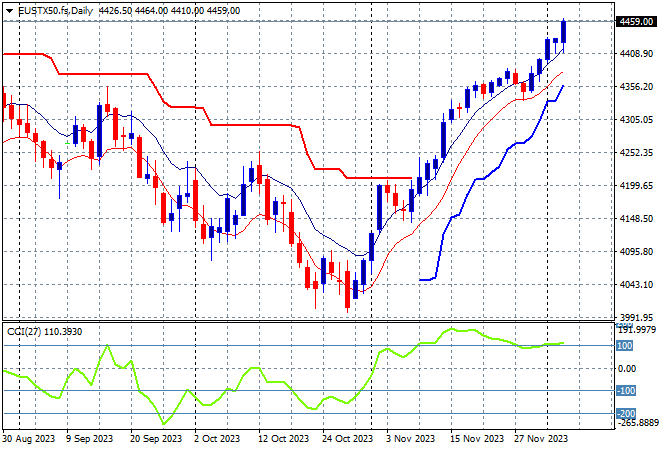
European markets had a much better session across the continent with steady results, as the Eurostoxx 50 Index eventually finishing 0.8% higher at 4452 points.
The daily chart shows weekly resistance at the 4300 point resistance level taken out with this large bounce setting up for further gains as momentum remains quite firm. Support is now upgraded to at least the 4300 point level with the lower Euro overnight again definitely helping here:
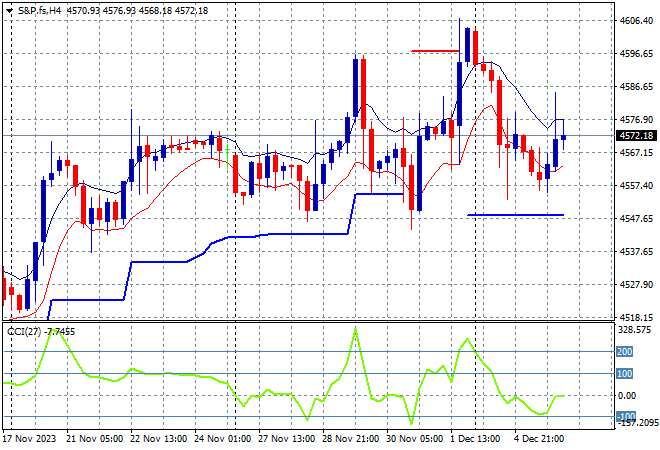
Wall Street however couldn’t sustain positive momentum from European bourses and pulled back with a small rebound at the end of the session seeing the NASDAQ lift some 0.3% while the S&P500 slipped 0.1% to close at 4567 points.
Short term momentum was overextended as price action consolidated around the 4540 point level mid week but has again moderated back to a neutral setting. Trailing ATR support on the daily chart has not been breached yet despite this volatile shake out in the past few sessions, but watch for any retracement below last week’s intrasession low at the 4550 level:
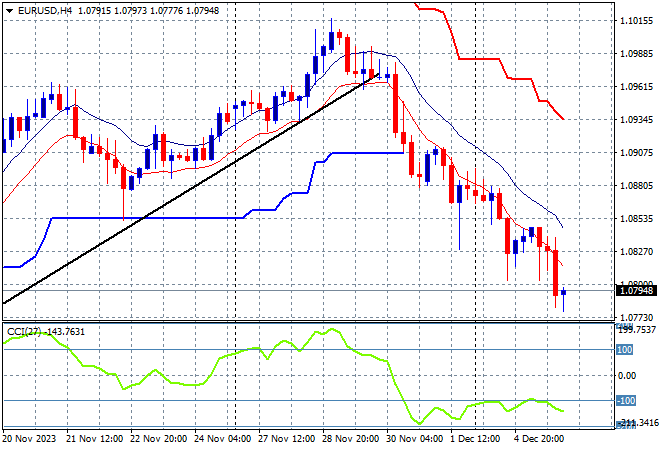
Currency markets saw a rebound in the US Dollar Index again overnight with Euro continuing its fall lower due to unchanged inflation expectations with a new weekly low below the 1.08 handle.
The union currency is now below its recent weekly lows around the 1.08 level after topping out at the 1.10 level earlier last week, unable to maintain momentum above the daily trendline. Short term momentum is now well oversold but we could see some mild consolidation here:
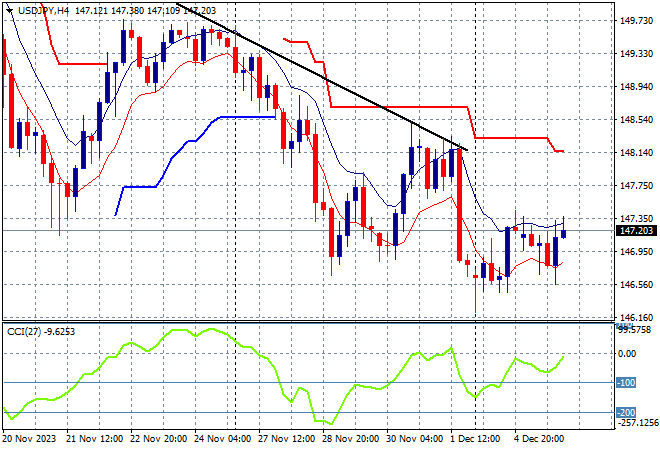
The USDJPY pair managed a small lift overnight as USD gained strength against most of the majors, but still looks weak here to be just above the 147 level proper and remaining below the weekly downtrend line.
Four hourly momentum showed the way with the inability on the recent bounce to get back into overbought mode with price action rolling over and staying in oversold settings. Watch for a breakdown below the mid week lows next:
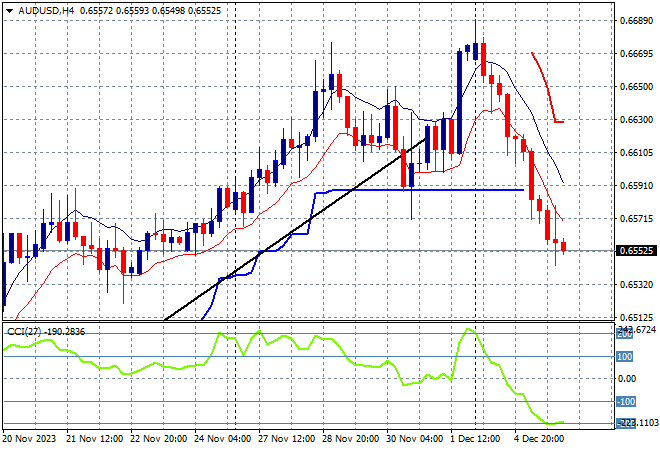
The Australian dollar is continuing to take more heat out of recent price action following yesterday’s RBA meeting with a retracement from its five month high back down to the 65 cent level to breach trailing ATR support on the four hourly chart.
The Pacific Peso remains under medium and long term pressure with short term momentum now oversold as well after a failure to breach the 67 cent level. Watch for a further pullback to the November lows:
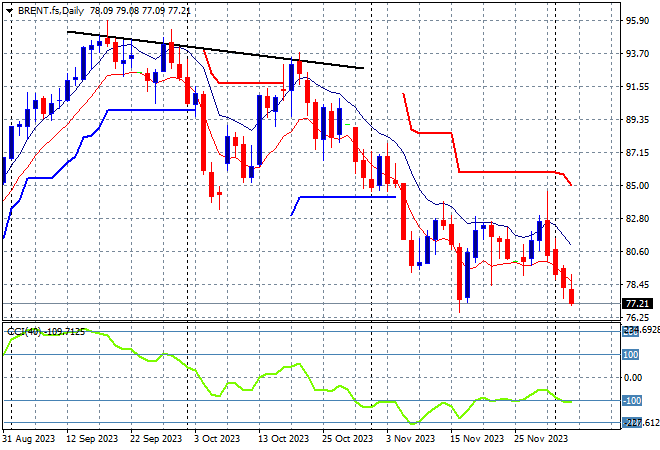
Oil markets remain in flux with the growing conflict in the Middle East and potential OPEC cuts adding to volatility with another down session overnight with Brent crude pushed below the $78USD per barrel level.
After almost reaching $100 in mid September, price was looking to return to the August levels around the $85 area where a point of control had been established before the recent breakout. Daily momentum is still in oversold settings with this failed test of support at the August level setting up for further falls below:
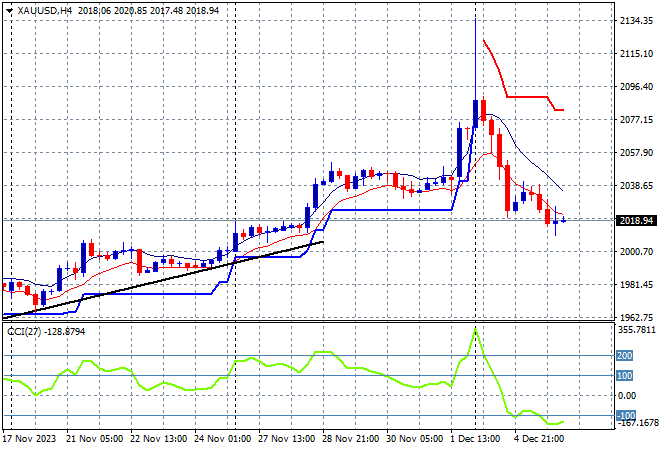
Gold is trying to calm down its recent wild ride with its previous surge through the $2100USD per ounce level now contained and brought back to last week’s price action area of support just below the $2020 level as of this morning.
Watch out for more profit taking if price action breaks below trailing ATR support and of course, the magical $2000 level:
Glossary of Acronyms and Technical Analysis Terms:
ATR: Average True Range – measures the degree of price volatility averaged over a time period
ATR Support/Resistance: a ratcheting mechanism that follows price below/above a trend, that if breached shows above average volatility
CCI: Commodity Channel Index: a momentum reading that calculates current price away from the statistical mean or “typical” price to indicate overbought (far above the mean) or oversold (far below the mean)
Low/High Moving Average: rolling mean of prices in this case, the low and high for the day/hour which creates a band around the actual price movement
FOMC: Federal Open Market Committee, monthly meeting of Federal Reserve regarding monetary policy (setting interest rates)
DOE: US Department of Energy
Uncle Point: or stop loss point, a level at which you’ve clearly been wrong on your position, so cry uncle and get out!wrong on your position, so cry uncle and get out!