
The September quarter National Accounts, released on Wednesday by the Australian Bureau of Statistics (ABS), revealed that the share of income paid towards income taxes has soared to near record highs.
The below chart from Alex Joiner, chief economist at IFM Investors, shows that income taxes consumed 17.2% of household gross income in the September quarter, which was only marginally below the 17.3% peak in the June quarter of 2000:
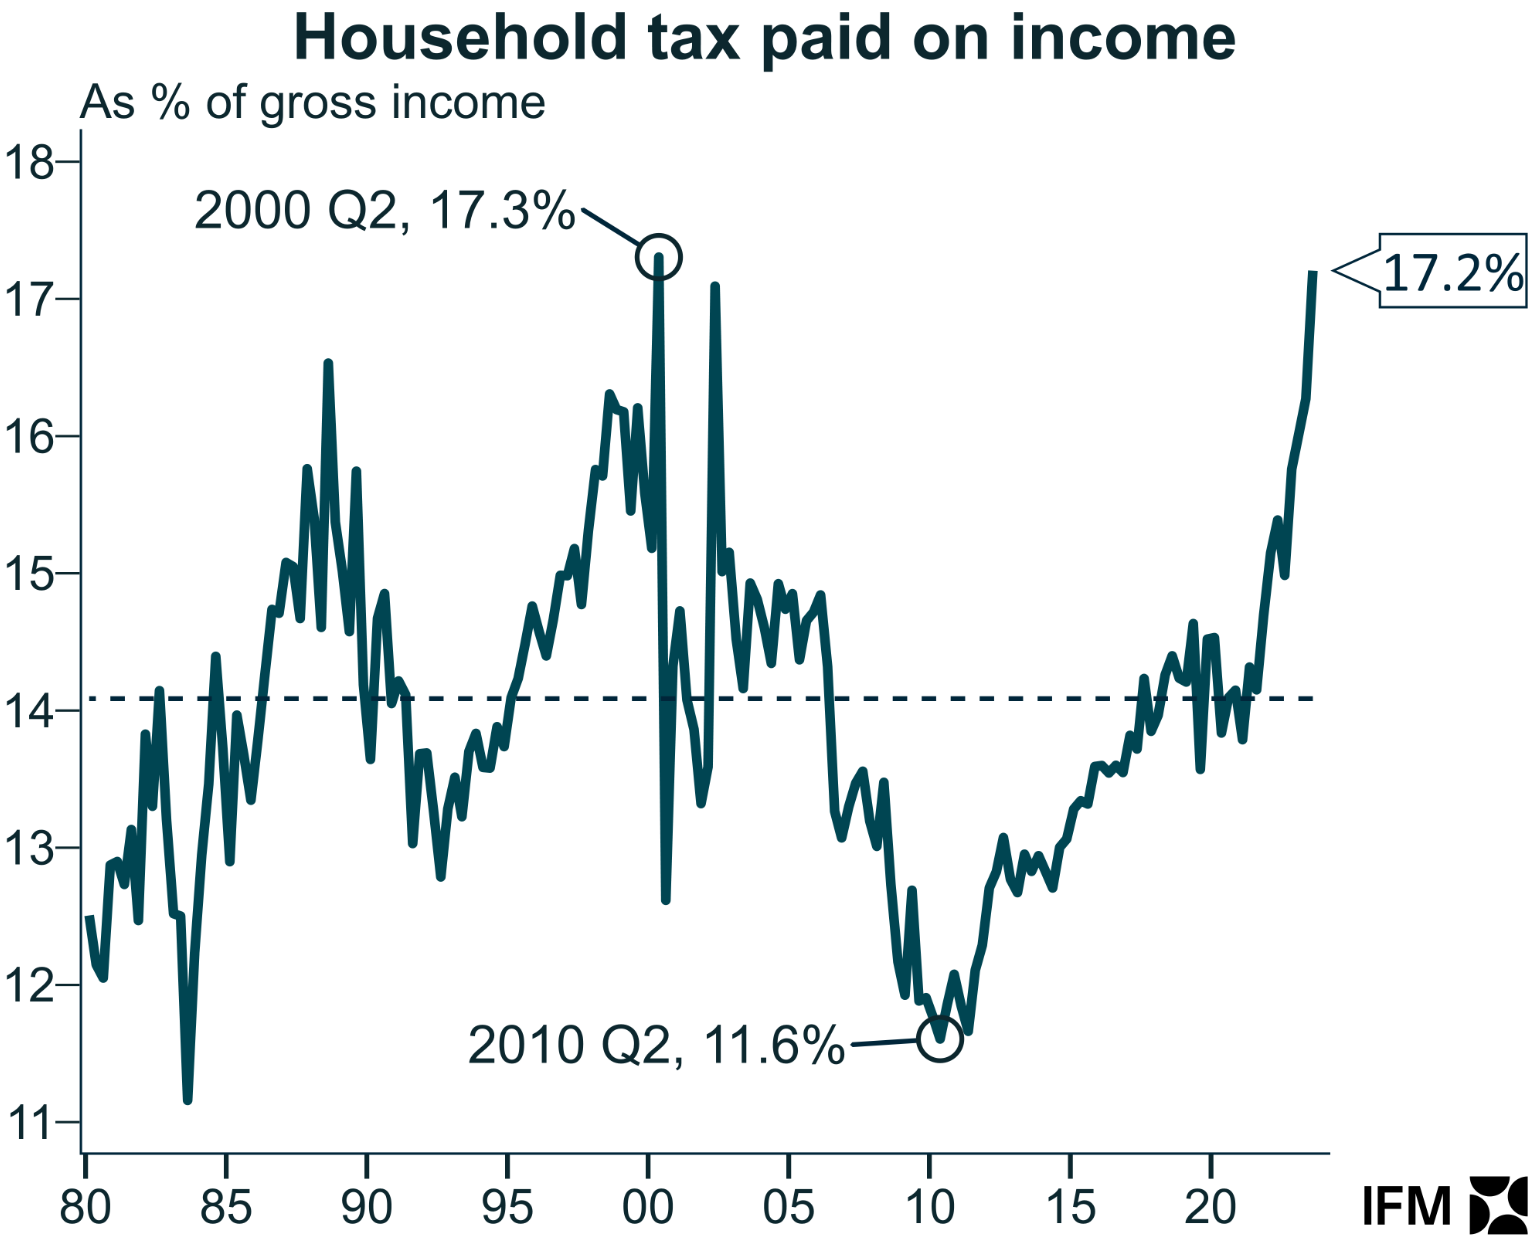
Source: Alex Joiner
The next chart from Joiner shows that gross household income payable is at its highest level since 1974:
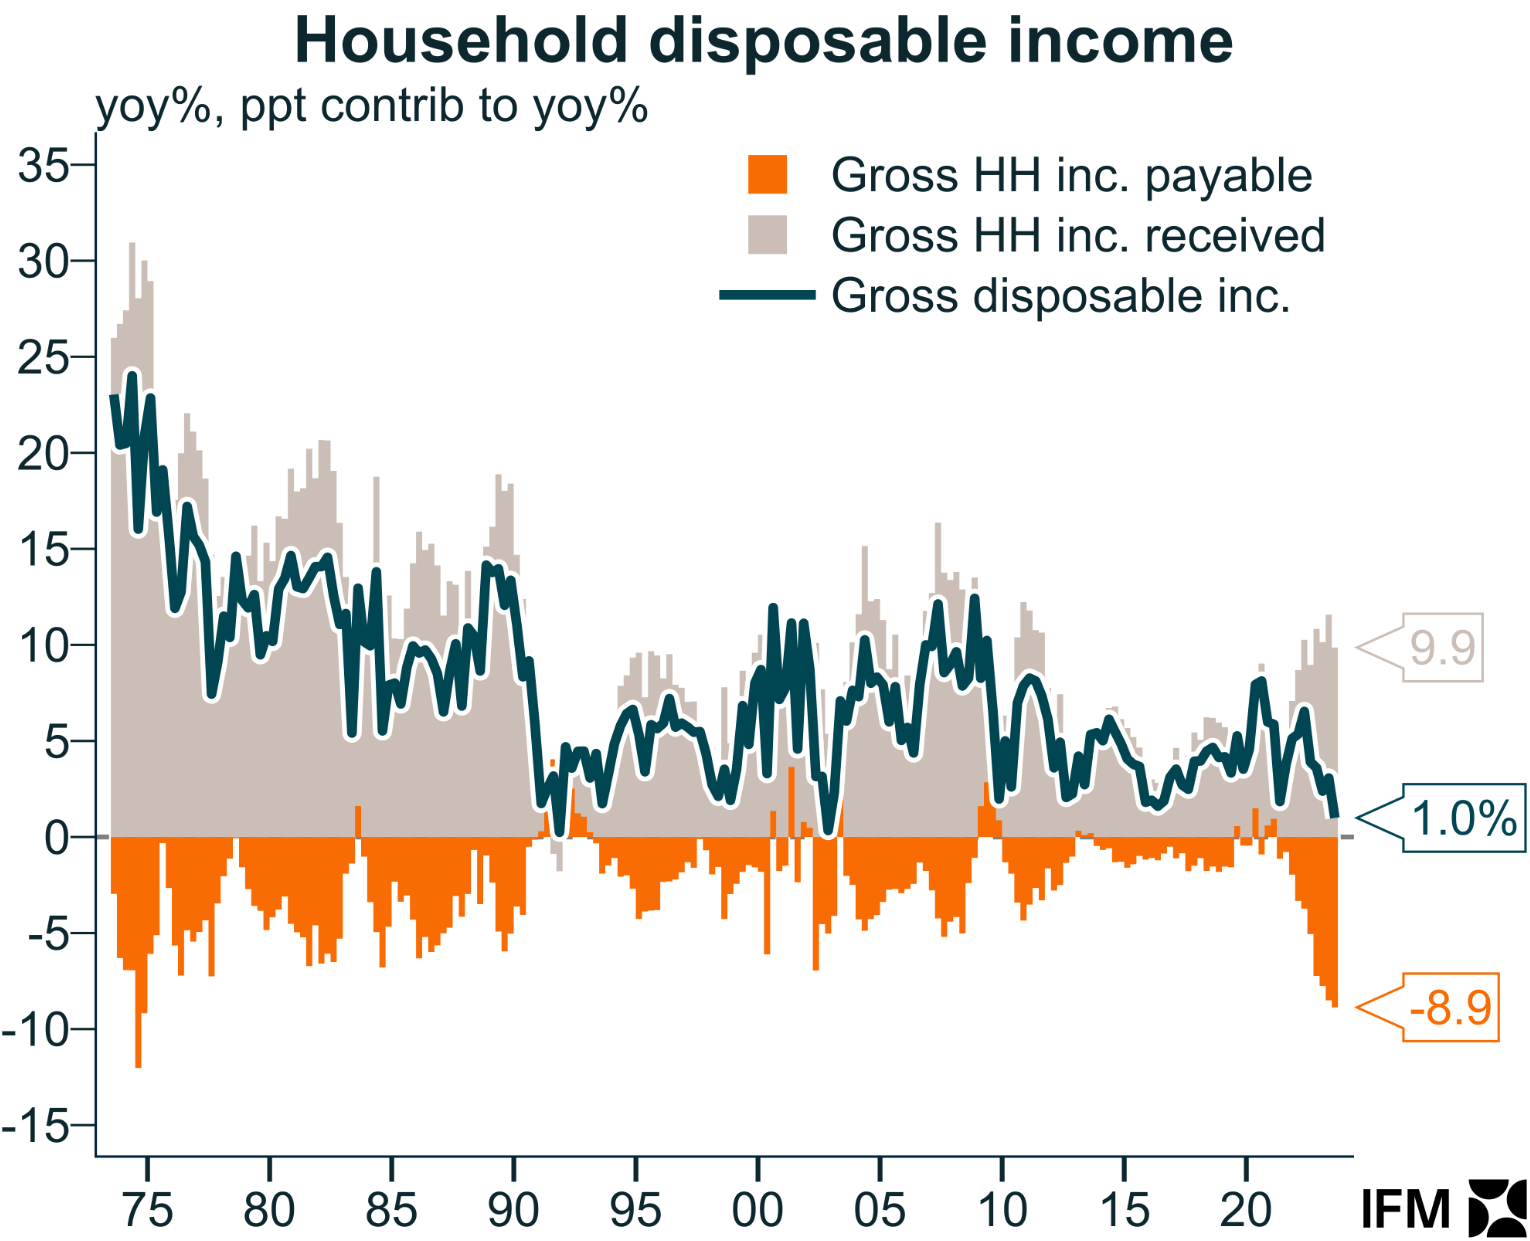
Source: Alex Joiner
“Households haven’t had this much of their gross incomes taken away from them since 1974 (gross incomes were a fair bit stronger back then though)”, Joiner commented on Twitter (X) in relation to the above chart.
The surge in income paid in taxes has come at the same time as the share of income spent on mortgage repayments has soared, as illustrated in the next chart by Justin Fabo at Macquarie Group:
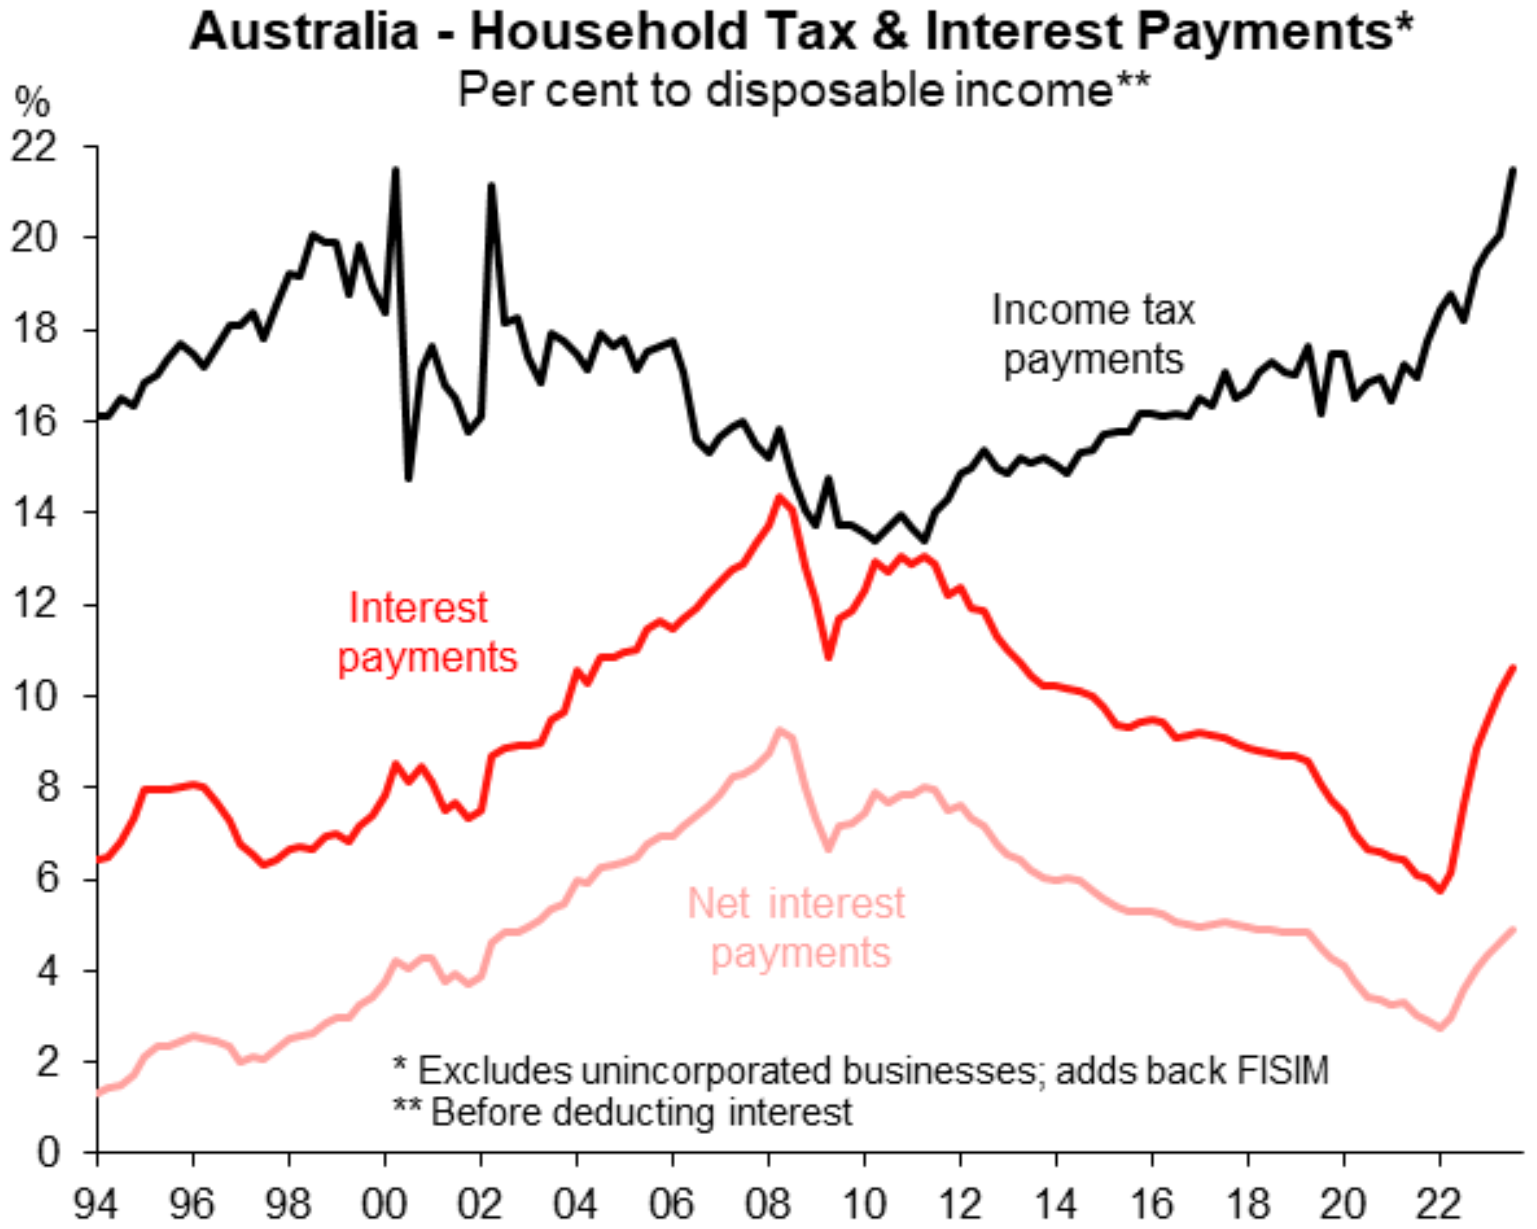
Source: Justin Fabo
The above charts help to explain why younger households have cut back heavily on their consumption, since they are drowning under rising mortgage repayments and taxes, alongside rents:
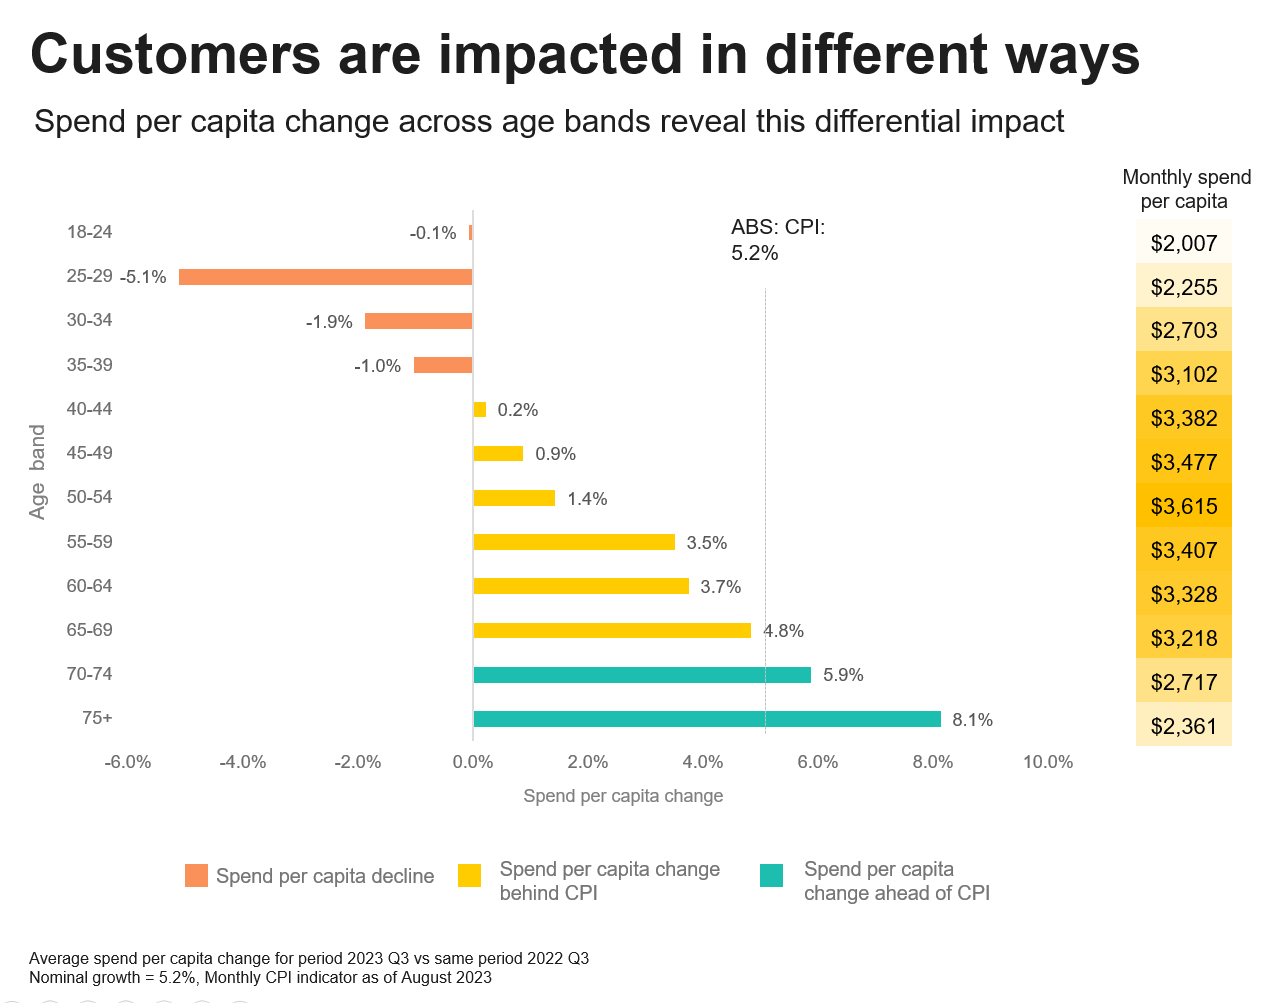
Source: CBA
By contrast, older Australians, who mostly do not pay income taxes and own their homes outright, are spending like drunken sailors.
In short, younger Australians are bearing the brunt of the RBA’s aggressive rate hikes, and are contributing the most to budget repair.
