Wednesday’s September quarter national accounts from the Australian Bureau of Statistics (ABS) were a shocker for households.
Arguably, the worst news was the record collapse in real household disposable income per capita, which collapsed by 5.8% over the year:
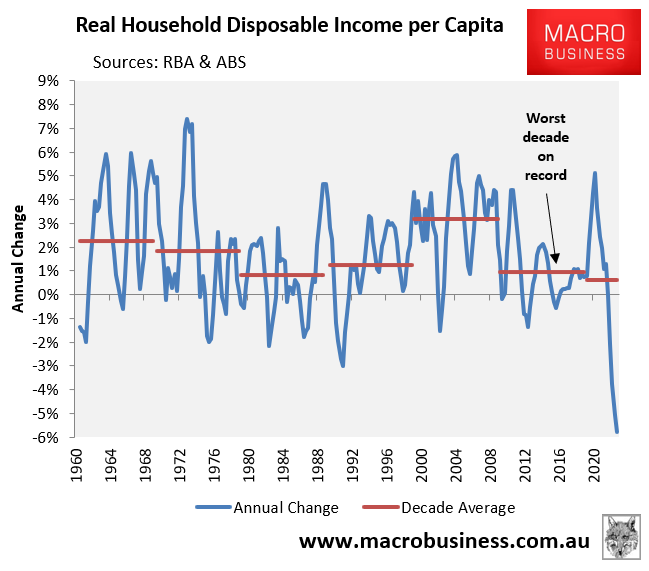
Last decade was the worst in recorded history for per capita household disposable income growth, averaging just 0.96% per year.
However, this decade is tracking even lower, averaging just 0.62% growth in per capita household disposable income a year.
As shown in the next chart, Australia’s real per capita household disposable income is now tracking at roughly the same level as December 2011, meaning we are back to the Rudd/Gillard government years in material living standards.
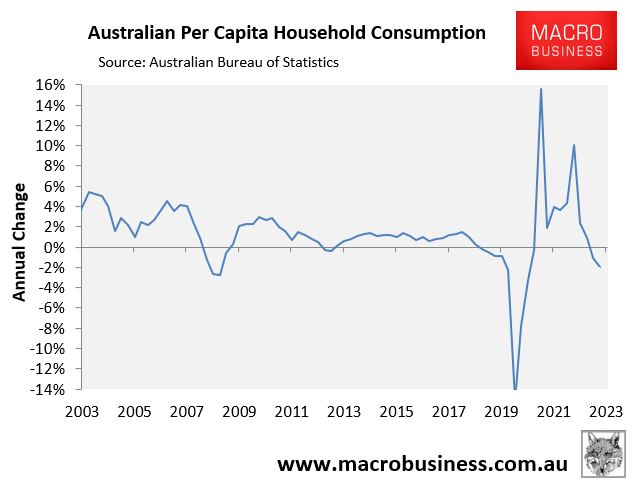
Meanwhile, real per capita household consumption fell by 1.9% in the year to September:
This collapse in household consumption occurred despite the household savings rate plummeting to only 1.1%, which was the lowest level since December 2007, before the Global Financial Crisis:
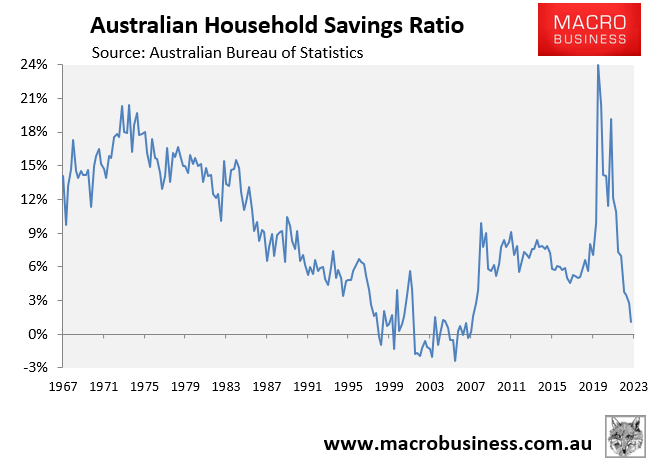
The decline in savings continued to support household spending and there is a high chance that this measure turns negative next year.
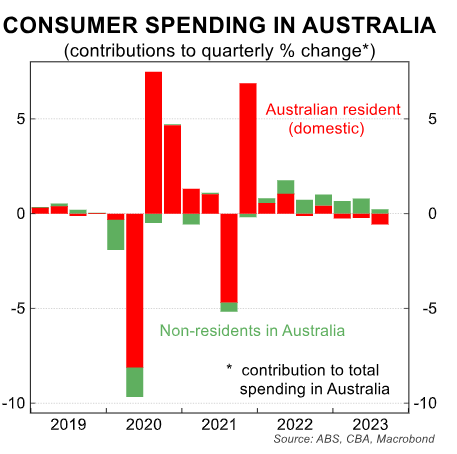
National accounts data published by CBA provides further insight into the collapse in consumption by Australian residents.
The next chart shows that the volume of domestic consumption by Australian residents fell by 0.6% over the September quarter. By contrast, spending by non-residents including international students as well as tourists (both measured as exports) rose by 4.4% over the quarter:
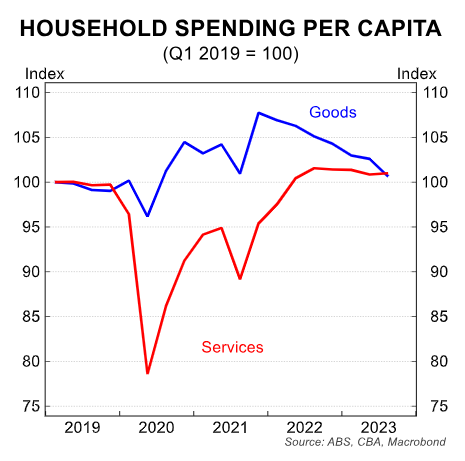
Household spending per capita has fallen more sharply for goods than services:
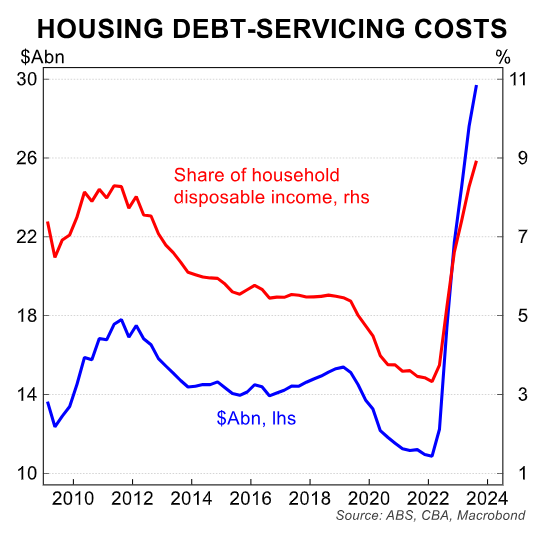
One of the reasons why household spending has contracted is because households are devoting a higher amount of money to interest repayments.
Housing debt servicing costs increased in dollar terms and as a share of household disposable income:
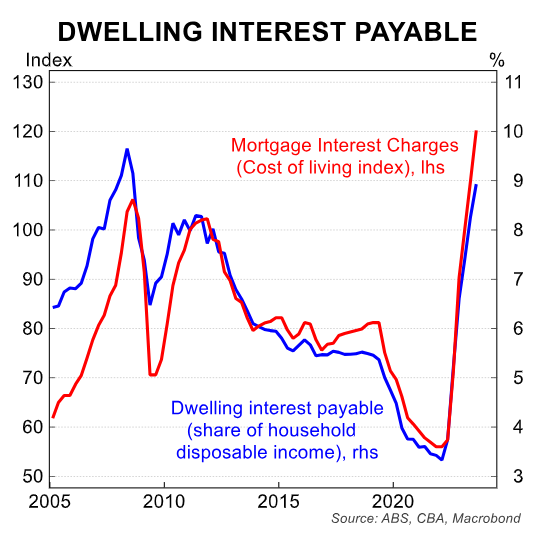
Dwelling interest payable rose by a further 7.6% over the quarter after a 12.4% rise in Q2 23, and is up by a massive 173.3% from its pandemic lows:
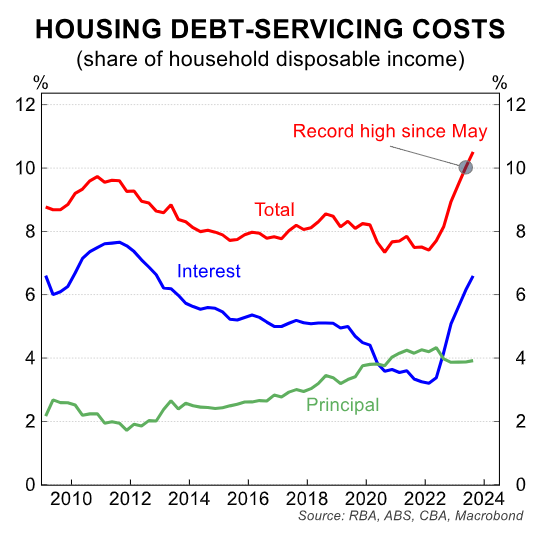
According, Australia’s debt servicing ratio (i.e. both principal and debt repayments) has soared to fresh record highs:
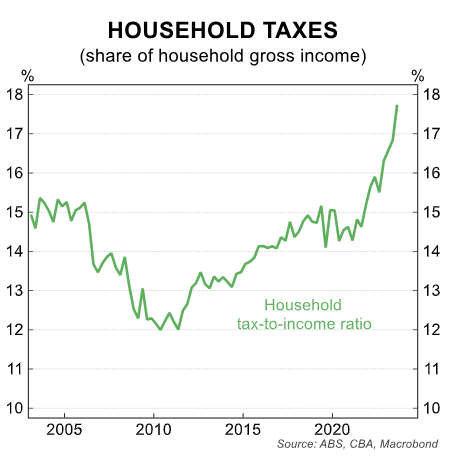
Add record tax payments into the mix:
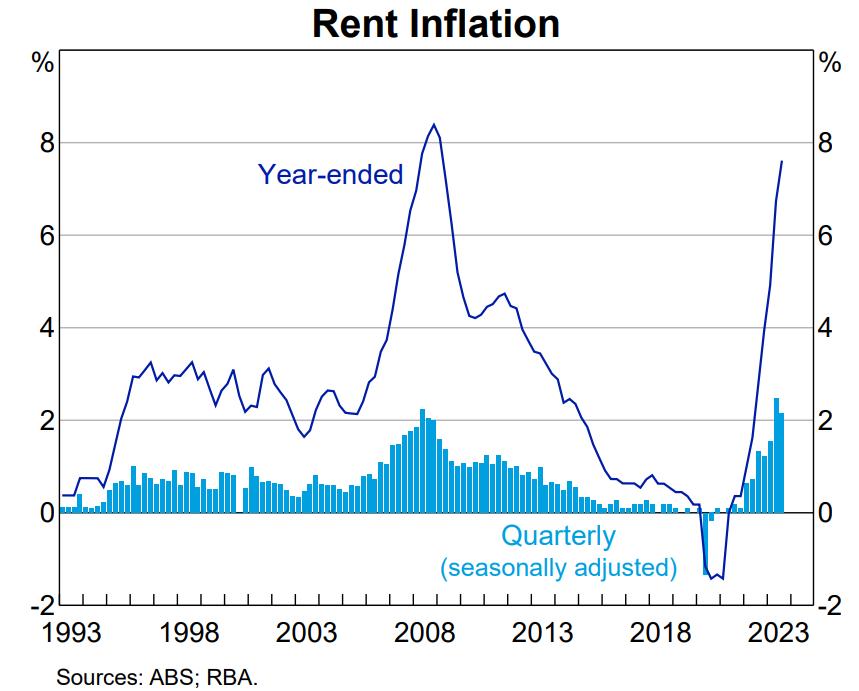
Alongside the sharp lift in rents:
And you have all the ingredients in place for financial Armageddon.
