
Bond yields fell back again but the USD finally found some life overnight on the back of upwardly revised 3Q GDP data while a slower than expected German CPI print was a headwind for Euro. Wall Street again had the wobbles while the Australian dollar pulled back to the 66 handle.
US bond markets saw falls across the yield curve with 10 year Treasury yields falling to their September lows at 4.2% while oil prices rebounded again as Brent crude lifted some 1.4% to nearly get back above the $83USD per barrel level. Gold held fast above the $2040USD per ounce level in a strong sign that support is clearly building for the shiny metal.
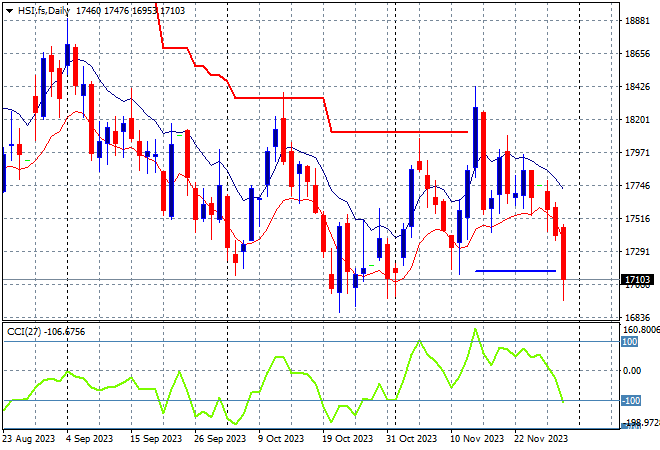
Looking at share markets in Asia from yesterday’s session where mainland Chinese share markets were unable to maintain positive momentum with the Shanghai Composite closing 0.6% lower to 3021 points while in Hong Kong the Hang Seng Index slumped again, this time losing more than 2% to 16993 points.
The daily chart was showing a significant downtrend that had gone below the May/June lows with the 19000 point support level a distant memory as medium term price action remains stuck in the 17000 point range. Daily momentum readings are retracing back to negative settings with price action now retracing back to the October lows:
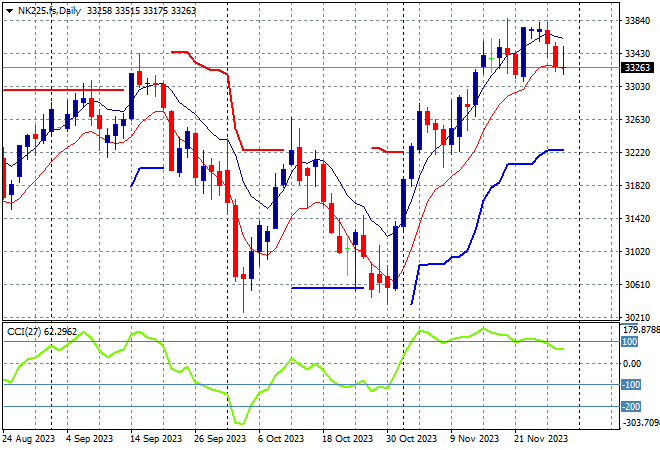
Japanese stock markets also couldn’t get back into the positive mood either with the Nikkei 225 losing 0.2% to 33321 points.
Trailing ATR daily support is a long way below the current bounce that has now exceeded the September highs at the 33000 point level with daily momentum still in the overbought zone but not over-extended. I’m still watching correlations with Wall Street and Yen to see if there is more upside here but a stall is evident:
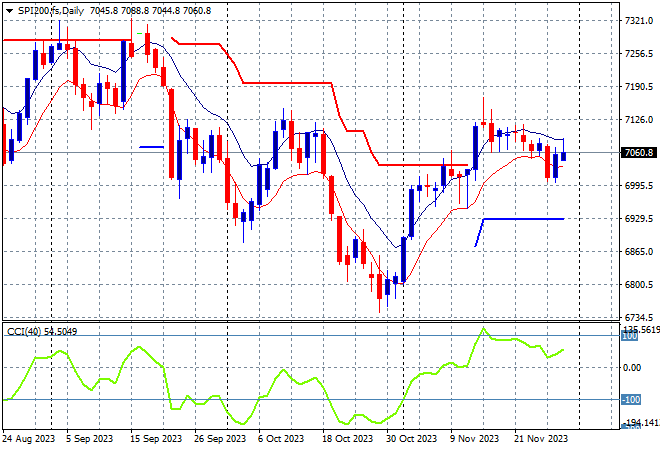
Australian stocks were the best performers in the region with the ASX200 closing some 0.3% higher, holding above the 7000 point support level to close at 7035 points.
SPI futures are dead flat however in line with the mixed session on Wall Street overnight so we should see the 7000 point level again fight out for either support or resistance. The daily chart was trying to look more optimistic here in the medium term with short term price action filling a hole against the tide, but its falling over now:
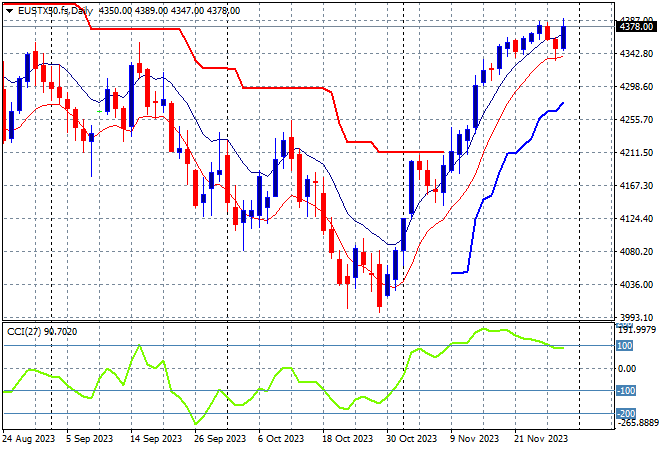
European markets did better than expected on the soft German CPI print but still hesitant overall due to the lack of direction from Wall Street with the Eurostoxx 50 Index lifting some 0.5% to finish at 4370 points.
The daily chart shows weekly resistance at the 4300 point resistance level taken out with this large bounce setting up for further gains if that level can be pushed aside proper. Support at the 4250 level should be quite firm on any pullback but I’m watching the much higher Euro possibly providing a headwind:
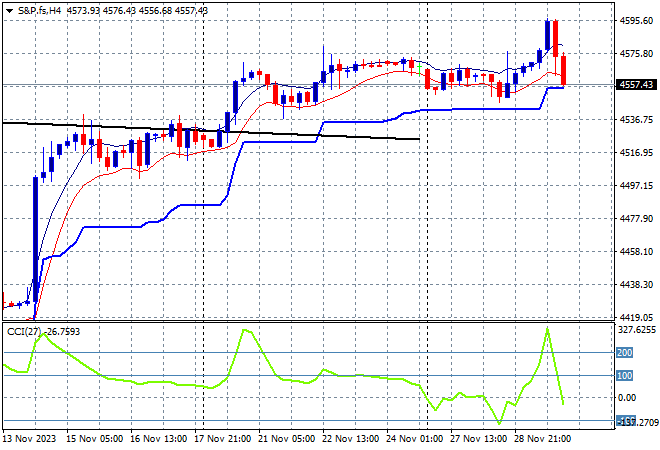
Wall Street was only positive on the headline Dow with Fedspeak upsetting the apple cart for the NASDAQ and S&P500 as both lost around 0.1% to continue this lacklustre trading week, the latter closing at 4550 points.
Short term momentum was overextended as price action bounced strongly off the recent low at the 4100 point level for the potential for a retracement back to trailing ATR support on the four hourly chart building here. Watch the 4500 point level to hold though:
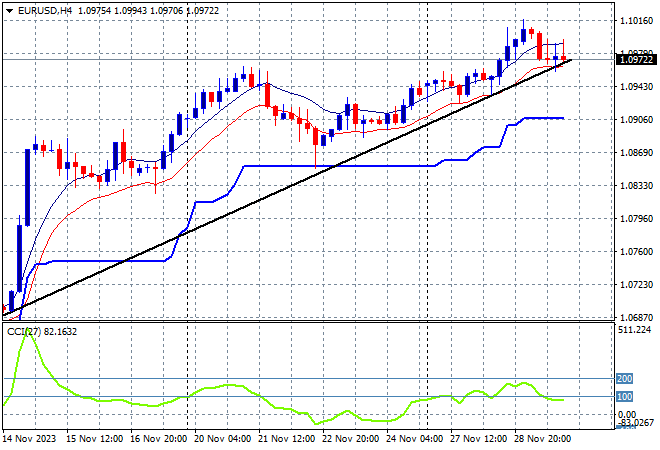
Currency markets are seeing a slight rebound in USD with the latest GDP data combining with soft German inflation numbers with Euro pulling back slightly after almost breaching the 1.10 handle.
The recent consolidation was after the union currency was able to fend off more Fedspeak in recent weeks and remain in a bullish, albeit neutral condition. Support at the recent weekly lows around the 1.06 level was not tested with new short term support upgraded to the 1.08 mid level at a minimum, but watch out here as short term momentum goes from overbought readings to a full retracement below the trend line:
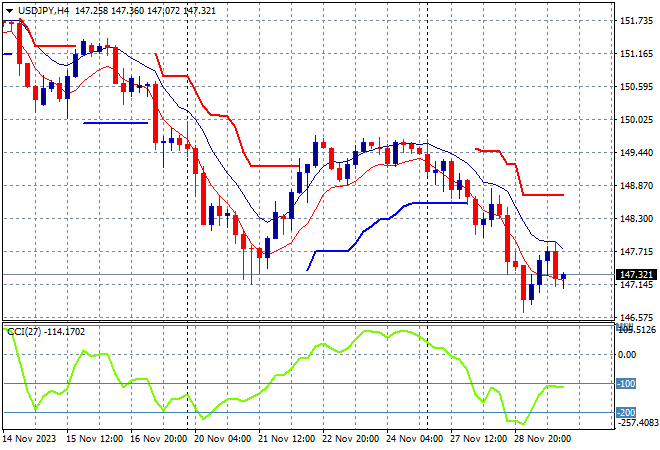
The USDJPY pair was able to make a meek attempt at a bounceback overnight but stumbled in the morning, finishing well below the 148 level proper again in a dead cat move.
Four hourly momentum showed the way with the inability on the recent bounce to get back into overbought mode with price action rolling over and staying in oversold settings. Watch for a breakdown below the 147 level next:
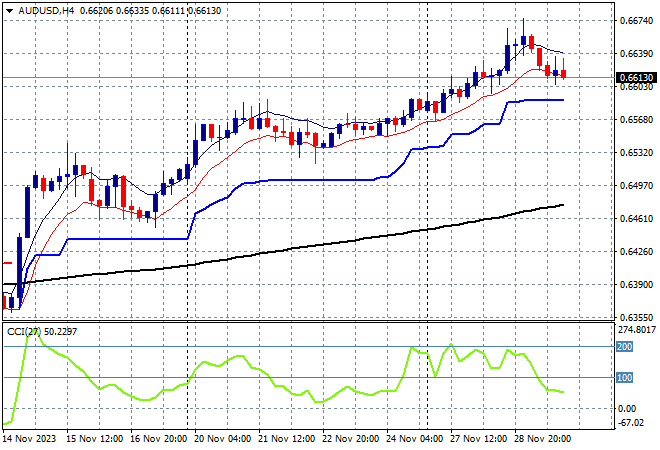
The Australian dollar finally pulled back overnight with USD able to put it somewhere in its place although its still resilient with price action hovering above the 66 cent level to hold on to its three month high.
The Pacific Peso remains under medium and long term pressure but was able to test the mid 63 level following the RBA’s recent rate hike with momentum now overbought and looking very positive as we continue this new trading week, but watch for a potential pullback to the 65 handle proper:
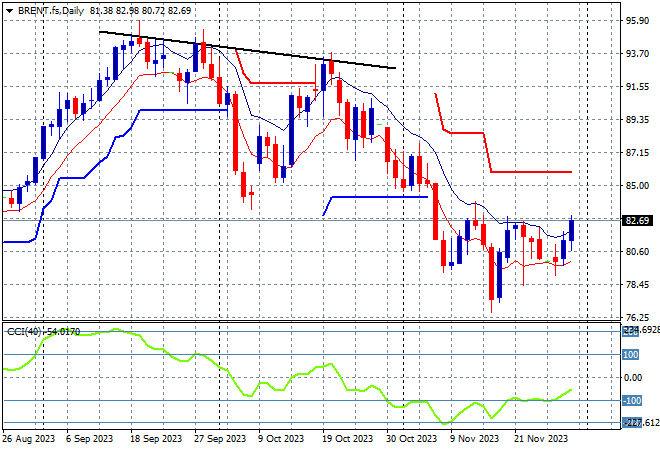
Oil markets remain in flux with the growing conflict in the Middle East and potential OPEC cuts adding to volatility with another rebound session overnight that saw Brent crude almost back above the $83USD per barrel level.
After almost reaching $100 in mid September, price was looking to return to the August levels around the $85 area where a point of control had been established before the recent breakout. Daily momentum is still in oversold settings with this failed test of support at the August level setting up for further falls below:
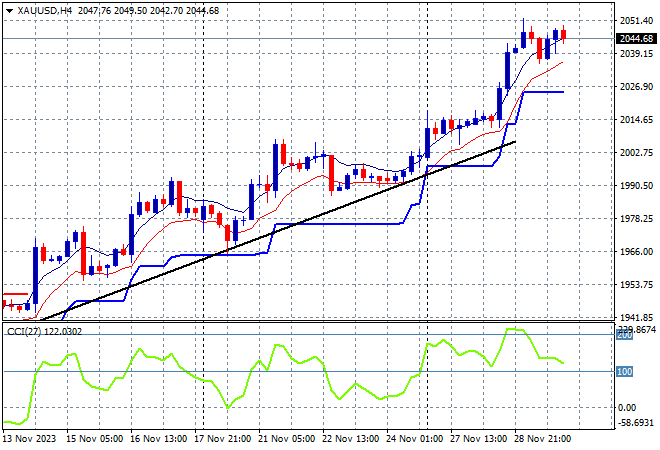
Gold is also holding on to its advances with almost no downside against a resurgent USD overnight, finishing where it started at the $2044USD per ounce level, but looking well overextended.
Daily support is building strongly again as the four hourly chart shows short term resistance pushed aside and price action on track with a lot of dip buying potential at any retracement toward trailing ATR support:
Glossary of Acronyms and Technical Analysis Terms:
ATR: Average True Range – measures the degree of price volatility averaged over a time period
ATR Support/Resistance: a ratcheting mechanism that follows price below/above a trend, that if breached shows above average volatility
CCI: Commodity Channel Index: a momentum reading that calculates current price away from the statistical mean or “typical” price to indicate overbought (far above the mean) or oversold (far below the mean)
Low/High Moving Average: rolling mean of prices in this case, the low and high for the day/hour which creates a band around the actual price movement
FOMC: Federal Open Market Committee, monthly meeting of Federal Reserve regarding monetary policy (setting interest rates)
DOE: US Department of Energy
Uncle Point: or stop loss point, a level at which you’ve clearly been wrong on your position, so cry uncle and get out!wrong on your position, so cry uncle and get out!