A slight change in sentiment overnight following the weekend absorption of the softer than expected US non-farm payrolls print on Friday night, with USD reasserting itself and pushing bond yields higher, with equities wobbling a bit on both sides of the Atlantic.
US bond markets saw a slight rise across the yield curve with 10 year Treasuries back up to the 4.6% level while oil prices moderated slightly again, with Brent crude just holding above the $85USD per barrel level. Gold is starting to lose momentum as it fails to get back above the $2000USD per ounce level, dropping to the $1977 level this morning.
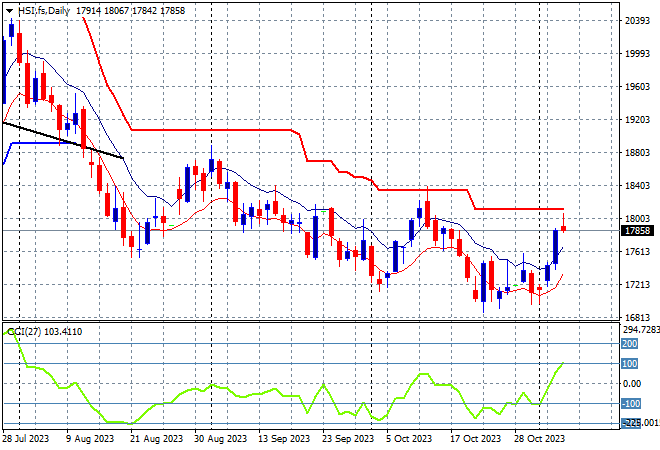
Looking at share markets in Asia from yesterday’s session where mainland Chinese share markets held on to their initial gains with the Shanghai Composite up more than 0.9% at 3058 points while in Hong Kong the Hang Seng Index surged more than 1.7% higher at 17966 points.
The daily chart is still showing a significant downtrend that has gone below the May/June lows with the 19000 point support level a distant memory as medium term price action stays well below the dominant downtrend (sloping higher black line) following the previous month long consolidation. Daily momentum readings however are now well out of oversold mode and price is breaking higher after bouncing off recent support levels, so there is a potential for a fill in rally here above ATR resistance at the 18000 point level:
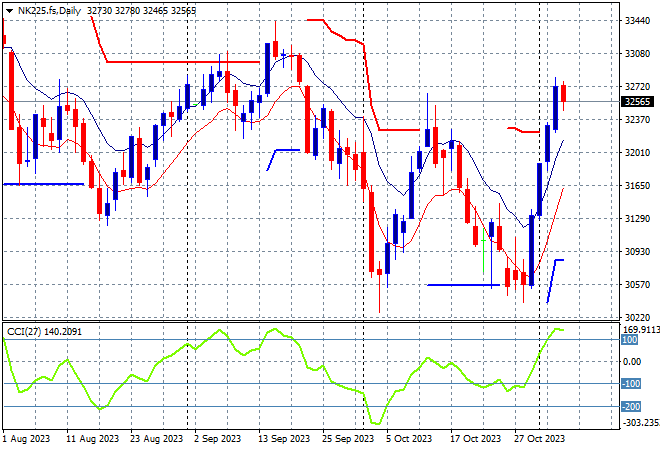
Japanese stock markets reopened after another market holiday with the Nikkei 225 surging more than 2% to close at 32708 points.
Trailing ATR daily resistance was coming under threat in a very fast bounceback with daily momentum retracing back from oversold settings to make a new weekly high here. Futures are indicating a slight pullback on the open with the September highs at the 33000 point level remaining the upside target to beat:
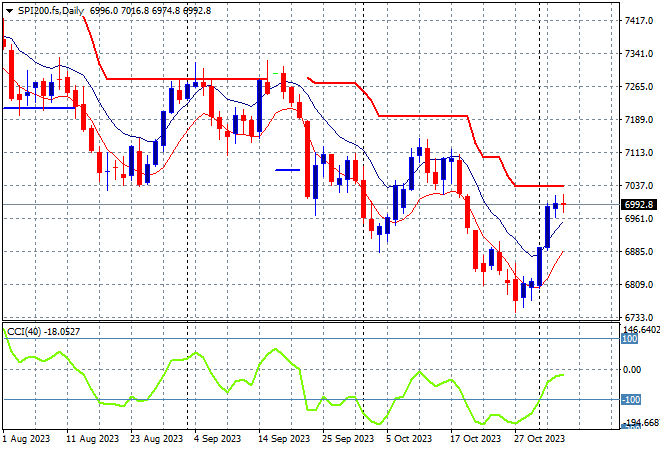
Australian stocks were the worst performers yesterday with only minor gains on the ASX200, closing just 0.3% higher at 6997 points, just shy of former support at 7000 points.
SPI futures are down 0.2% so we should see the 7000 point resistance level potentially firming again as it remains strong in the medium and short term. The daily chart is still not looking optimistic here in the medium term but short term price action is trying to fill a hole here but watch out for the RBA:
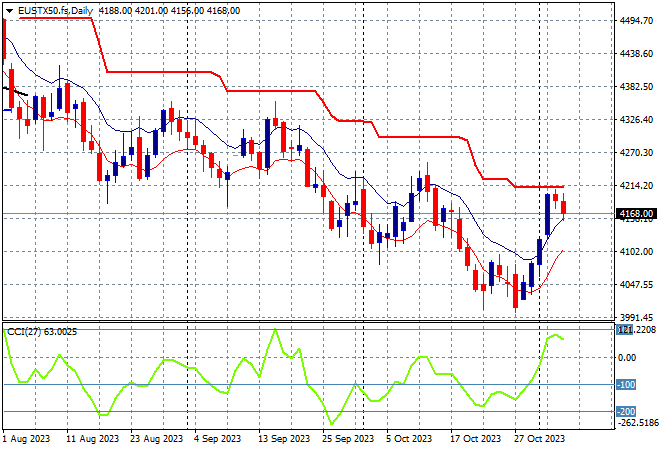
European markets were unable to continue their own bounceback with the Eurostoxx 50 Index losing some 0.4% to finish at 4158 points.
The daily chart shows an overall decline with weekly support at 4100 points no longer defended, as weekly resistance firms at the 4300 point resistance level. There were signs the previous little bounce was running out of steam as daily momentum remained neutral at best, with a rebound out of oversold settings now encroaching on trailing ATR resistance above but possibly turning into a dead cat bounce:
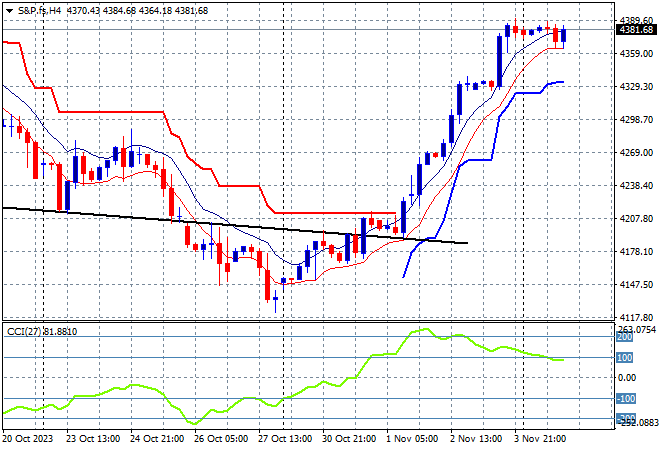
Wall Street was unable to follow through on Friday night’s bullishness surrounding the NFP print with a lack of momentum as the NASDAQ lifted just 0.3% while the S&P500 barely put on 0.1% to finish at 4363 points.
Short term momentum remains well overextended after this sharp short covering rally as price action bounced strongly off the recent low at the 4100 point level. There is the potential for a retracement back to trailing ATR support on the four hourly chart back down to the 4330 point level to take some heat out of this:
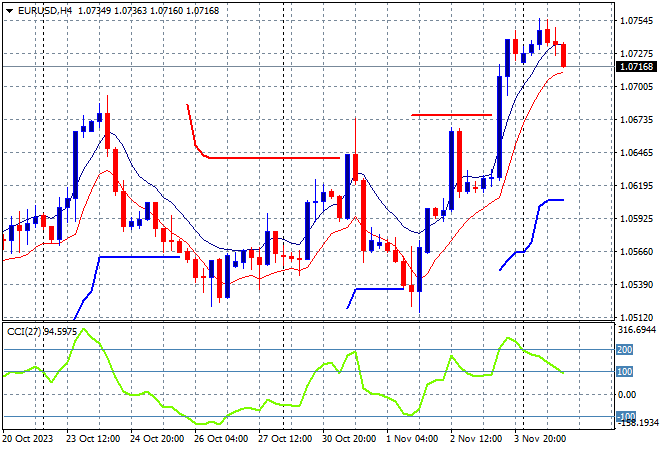
Currency markets remain highly volatile with turbulence from the NFP print slowly seeing some major currency pairs pulling back against King Dollar. Euro was unable to extend its gains and is circling around the 1.07 handle after being extremely overbought.
Support at the recent weekly lows around the 1.05 level was tested before the Fed meeting last week with only a small bounce thereafter but price action was able to translate into a harder result on the soft jobs report up to a new two week high – but is extremely over extended and ripe for a minor pullback at least:
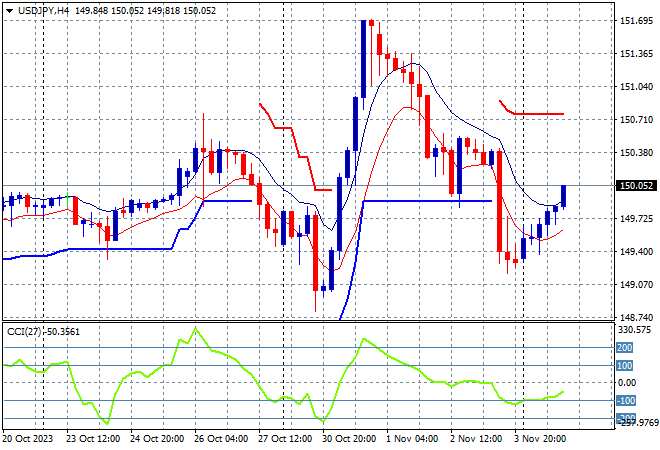
The USDJPY pair did the reverse move, surging up through the 150 handle – just – to arrest about half of its Friday night declines.
Four hourly momentum remains hard to read here after retracing from extreme overbought settings and now slightly oversold, with price action now returning back to the previous ATR support level. Watch for a potential consolidation here with increased volatility:
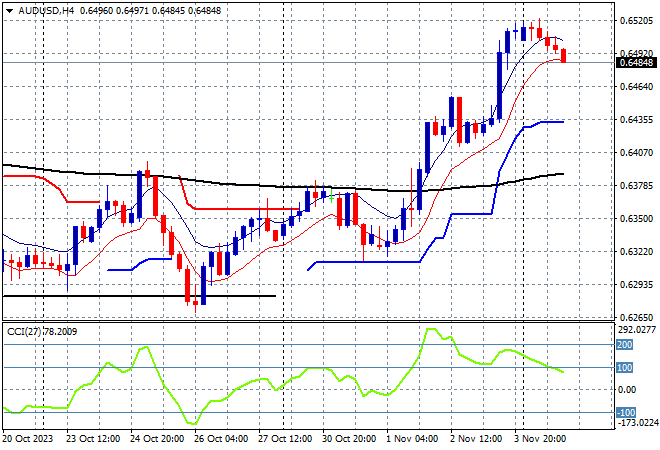
The Australian dollar is starting to turnover here as USD bulls step back into the fray with today’s RBA meeting now coming more into focus after a big run up last week to the 65 cent level for a new monthly high.
Last night saw a mild retracement below the 65 handle with the Pacific Peso still under medium and long term pressure with the potential to fall very flat on its face if the RBA decides to hold today:
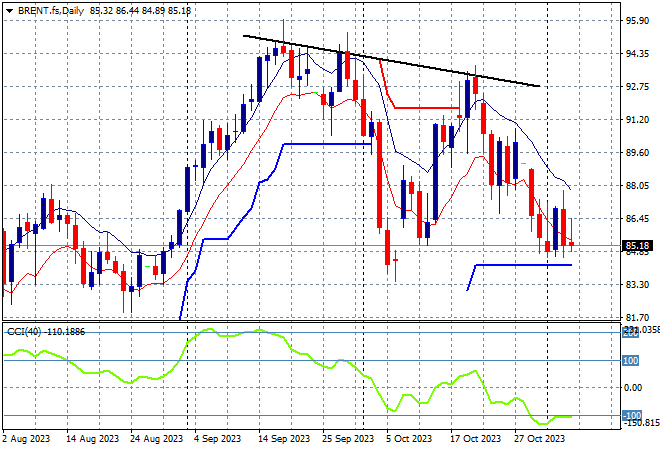
Oil markets remain volatile in the wake of growing conflict in the Middle East with another retracement after a very minor bounce off the recent lows, with Brent crude back down to the $85USD per barrel level.
After almost reaching $100 in mid September, price was looking to return to the August levels around the $85 area where a point of control had been established before the recent breakout. Daily momentum is still at negative settings with a retest of support at the August level likely again:
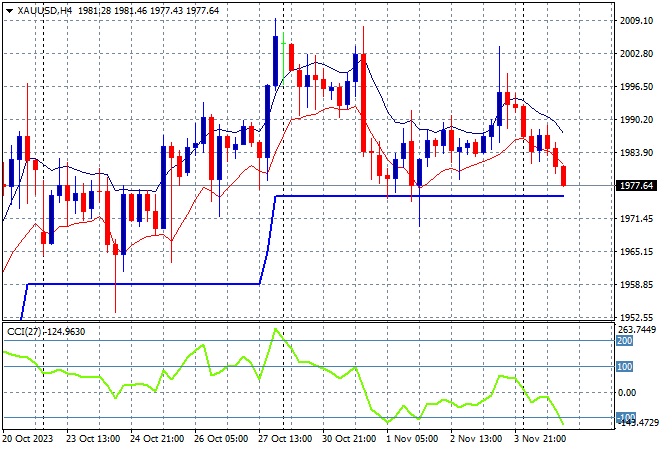
Gold is slowly losing its grip as the best undollar as its former strong position after finally breaking through the $2000USD per ounce level is turning into a mild dip as heads towards daily support at the $1970 area.
While this new breakout put in a new monthly high, daily momentum was looking overbought and ripe for a pullback back to retest the $1900 level, as ATR support on the four hourly chart becomes the next target so watch below:
Glossary of Acronyms and Technical Analysis Terms:
ATR: Average True Range – measures the degree of price volatility averaged over a time period
ATR Support/Resistance: a ratcheting mechanism that follows price below/above a trend, that if breached shows above average volatility
CCI: Commodity Channel Index: a momentum reading that calculates current price away from the statistical mean or “typical” price to indicate overbought (far above the mean) or oversold (far below the mean)
Low/High Moving Average: rolling mean of prices in this case, the low and high for the day/hour which creates a band around the actual price movement
FOMC: Federal Open Market Committee, monthly meeting of Federal Reserve regarding monetary policy (setting interest rates)
DOE: US Department of Energy
Uncle Point: or stop loss point, a level at which you’ve clearly been wrong on your position, so cry uncle and get out!wrong on your position, so cry uncle and get out!