
Two large economic events overnight saw bond markets pull back from their recent selloff with a drop in yields as US GDP data stronger than expected, but with an easing of price pressures. The ECB had its monthly meeting and decided on a pause, signalling softer economic conditions but this was a little spooky for both European and US share markets which continued to selloff.
The USD was up slightly on the day with Euro range trading on the ECB decision while the Australian dollar remains anchored at the 63 cent level.
US bond markets saw a sharp drop in 2 year Treasury yields while 10 year Treasuries fell back through the 4.8% level. Meanwhile oil prices fell another 2%, with Brent crude back down to the $88USD per barrel level. Gold consolidated again to the upside as it pushed slightly higher above the $1980USD per ounce level.
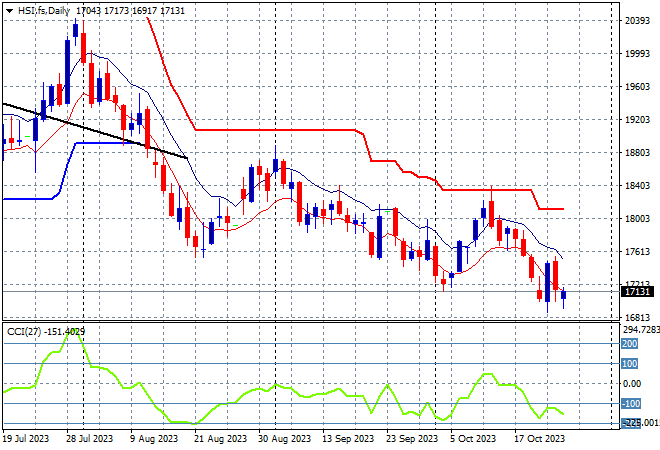
Looking at share markets in Asia from yesterday’s session where mainland Chinese share markets dropped back before the long lunch break then got going into the close with the Shanghai Composite gaining nearly 0.5% at 2988 points while in Hong Kong the Hang Seng Index fell 0.2%, closing at 17044 points.
The daily chart is still showing a significant downtrend that has gone below the May/June lows with the 19000 point support level a distant memory as medium term price action stays well below the dominant downtrend (sloping higher black line) following the previous month long consolidation. Daily momentum readings are stuck in oversold mode and price is now well below recent support levels, so watch out below:
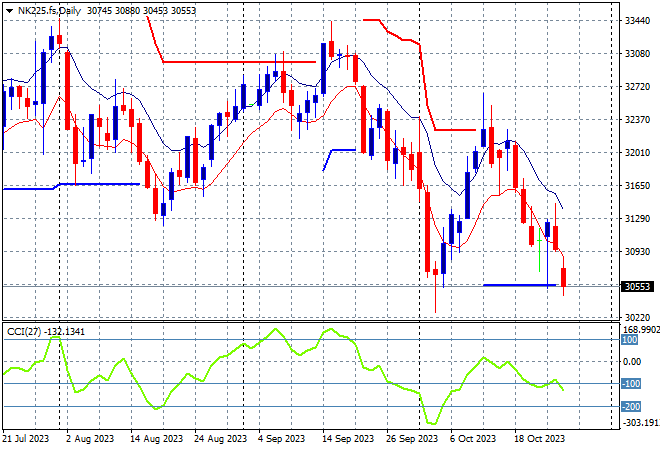
Japanese stock markets however lost the most ground with the Nikkei 225 closing some 2.1% lower at 30601 points.
Trailing ATR daily resistance was coming under threat in a very fast bounceback and while daily momentum retraced back from oversold settings as price action is following Chinese markets with a typical dead cat bounce pattern forming here. Futures are indicating another move lower on the open as I’m still watching for a return to the previous monthly low at 30000 points proper:
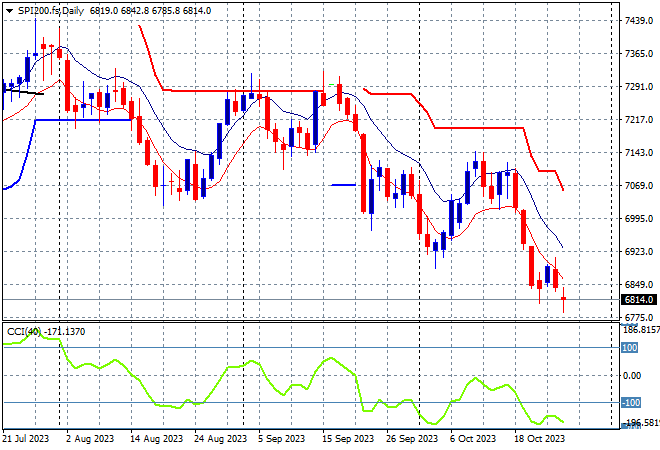
Australian stocks were unable to escape the selling with the ASX200 closing 0.6% lower at 6812 points, firming the break below at 7000 points from last trading week.
Without relief across the risk complex, SPI futures are somewhat flat but I expect another test of the 6800 point level on the open this morning with the 7000 point level still firming strongly as short term resistance. The daily chart is not looking optimistic here with medium term price action continuing to move sideways at best:
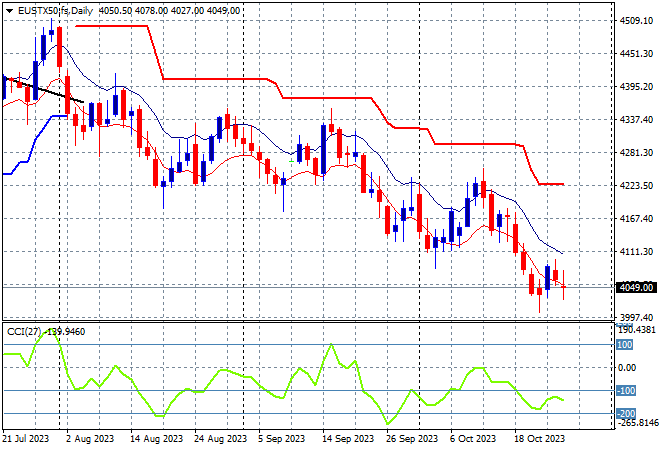
European markets again failed to re-engage to the upside despite the ECB pause with the Eurostoxx 50 Index eventually losing some 0.6% to finish at 4049 points.
The daily chart shows an overall decline with weekly support at 4100 points no longer defended, as weekly resistance firms at the 4300 point resistance level. There were signs the previous little bounce was running out of steam as daily momentum remained neutral at best, with a return to oversold settings now setting up further downside:
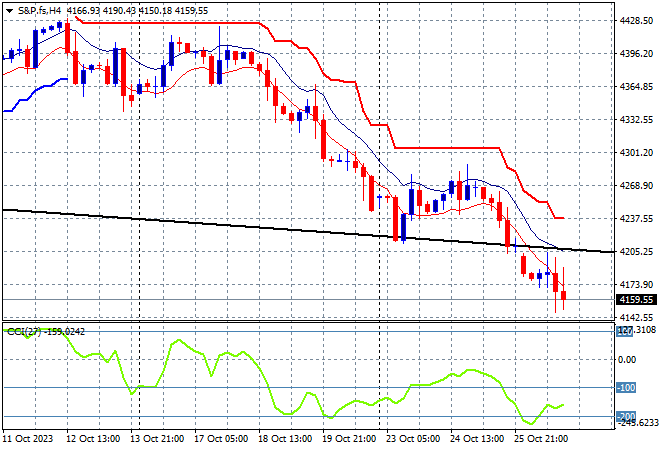
Wall Street was unable to gain any positive momentum from the get go with losses again across the three bourses as the NASDAQ fell more than 1.7% while the S&P500 lost another 1.2% to finish at 4137 points.
The daily chart is still showing a clear downtrend with a series of lower weekly lows with yet another one created overnight. Short term momentum was getting out of oversold territory as price action firmed near this new low, but the potential swing trade evaporated as the downtrend line has been broken again:
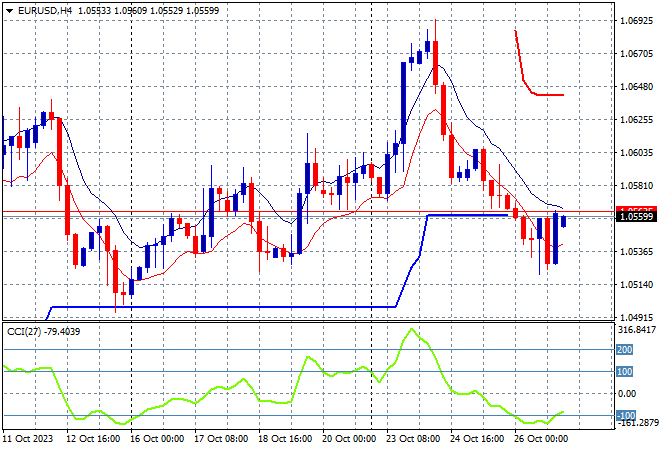
Currency markets reduced somewhat in volatility on the back of the ECB meeting as USD lifted just slightly against the undollar complex. Euro range traded but remains below the 1.06 handle.
On the four hourly chart the union currency had finally broke through short/medium term resistance at the 1.06 handle at the start of the week, pushing short term momentum to extremely overbought levels. Support at the recent weekly lows around the 1.05 level was very firm before this move but is going to be tested here:
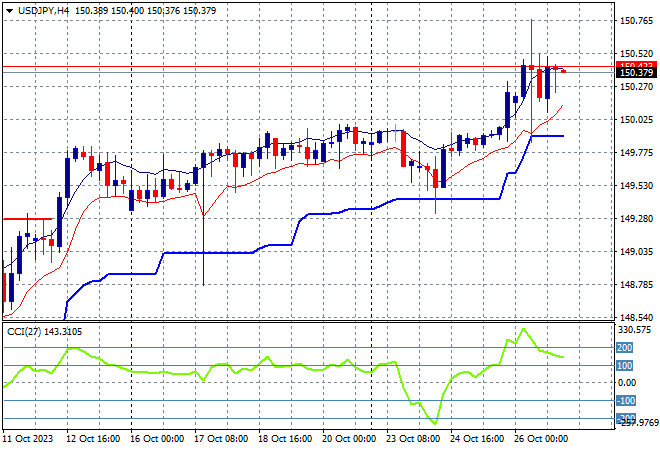
The USDJPY pair is still lifting out of its holding pattern on the return of USD strength to finally push above the 150 handle and a new weekly high, after a brief pull back to trailing ATR support.
Four hourly momentum shows a return to well overbought settings after a proper test of support at the 149 level with the floodgates potentially open from here:
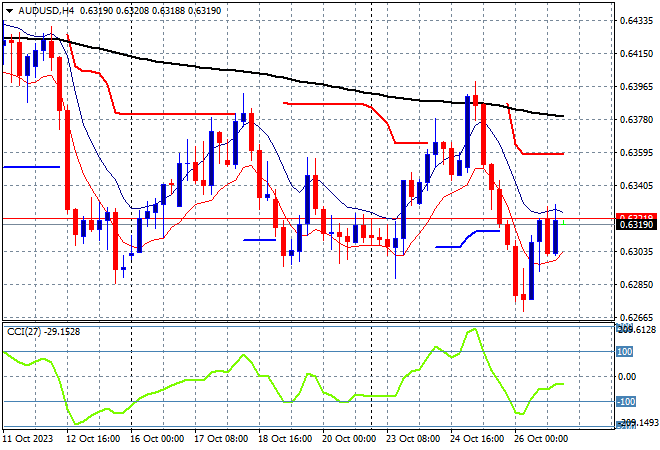
The Australian dollar was dragged below the 63 handle in the previous session with another brief bounce overnight that saw it return just above that level as of this morning, but still looking tenuous at best.
The Pacific Peso remains under medium and long term pressure with price action just not being translated into anything sustainable as the four hourly chart shows the potential to drop lower but I think traders are awaiting next week’s RBA meeting:
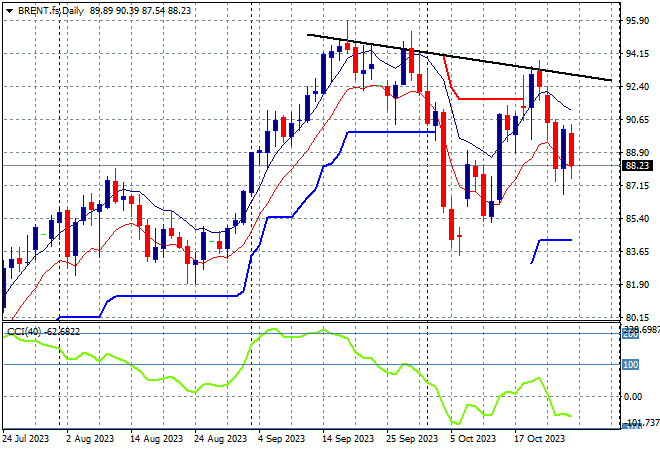
Oil markets are failing to shake off recent volatility with yet another reversal overnight, losing nearly 2% as Brent crude returned to just above the $88USD per barrel level, after a series of lower daily highs since the mid September levels.
After almost reaching $100 in mid September, price was looking to return to the August levels around the $85 area where a point of control had been established before the recent breakout. Daily momentum is now back to negative settings with a retest of support at the August level, so watch for a possible slump to the $84 zone soon:
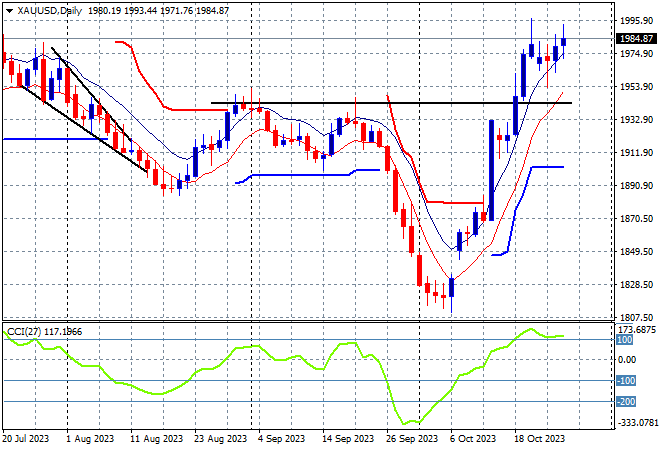
Gold remains the best undollar by holding on to its strong position overnight as it continues to lead the undollars, holding at the new monthly high just above the $1980USD per ounce level.
The daily chart shows quite a steep uptrend since the previous weekend gap higher as momentum remained very positive in the short term, trying to get back up to the $2000 level. This new breakout puts in a new monthly high with daily momentum now looking overbought and ripe for a pullback back to retest the $1900 level again, but so far no change as it builds above the $1970 level:
Glossary of Acronyms and Technical Analysis Terms:
ATR: Average True Range – measures the degree of price volatility averaged over a time period
ATR Support/Resistance: a ratcheting mechanism that follows price below/above a trend, that if breached shows above average volatility
CCI: Commodity Channel Index: a momentum reading that calculates current price away from the statistical mean or “typical” price to indicate overbought (far above the mean) or oversold (far below the mean)
Low/High Moving Average: rolling mean of prices in this case, the low and high for the day/hour which creates a band around the actual price movement
FOMC: Federal Open Market Committee, monthly meeting of Federal Reserve regarding monetary policy (setting interest rates)
DOE: US Department of Energy
Uncle Point: or stop loss point, a level at which you’ve clearly been wrong on your position, so cry uncle and get out!wrong on your position, so cry uncle and get out!