
Further moves to risk aversion on Friday night as Middle East tensions dominated equity markets at least, with breakdowns evident across Wall Street and European shares, while fixed income and FX markets were relatively sanguine. The USD was slightly under the pump as the Australian dollar continues to float sideways around the 63 cent level.
US bond markets saw a test of the 5% yield for 10 year Treasuries, while oil prices tried to breakout but pulled back slightly instead as Brent crude remained slightly below the $93USD per barrel level. Gold remained untouched by USD strength with another strong lift, this time exceeding the $1980USD per ounce level.
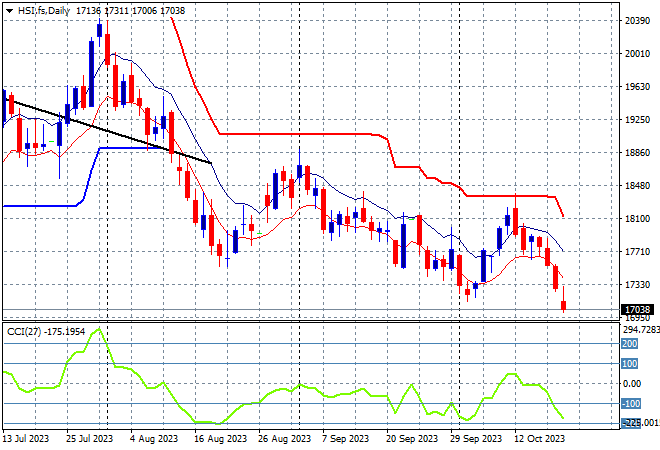
Looking at share markets in Asia from yesterday’s session where mainland Chinese share markets dropped back sharply with the Shanghai Composite down 0.8% to close at 2980 points while in Hong Kong the Hang Seng Index was off by more than 0.7%, down to 17172 points.
The daily chart is still showing a significant downtrend that has gone below the May/June lows with the 19000 point support level a distant memory as medium term price action stays well below the dominant downtrend (sloping higher black line) following the previous month long consolidation. Daily momentum readings are stuck in oversold mode and price is now well below recent support levels, so watch out below:
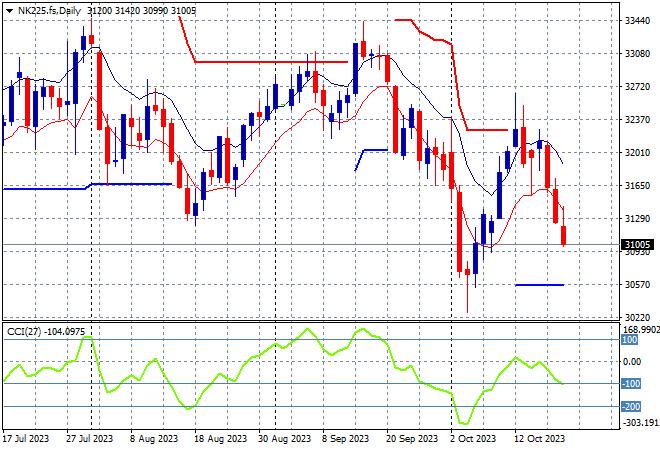
Japanese stock markets were looking to put in mild scratch sessions but the Nikkei 225 stumbled at the close, finishing 0.5% lower at 31259 points.
Trailing ATR daily resistance was coming under threat in a very fast bounceback and while daily momentum retraced back from oversold settings as price action is following Chinese markets with a typical dead cat bounce pattern forming here. Futures are indicating another big move lower on the open so I’m watching for a return to the previous monthly low at 30000 points proper:
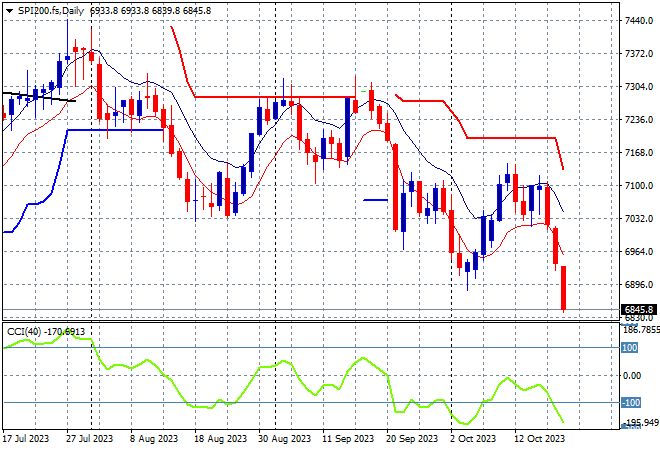
Australian stocks were again unable to escape the selling with the ASX200 closing 1.1% lower at 6900 points, completing the break below at 7000 points in the previous session.
With declines across the risk complex, SPI futures are indicating at least a 1% drop on the weekend gap open this morning with the 7000 point level now firming strongly as short term resistance. The daily chart is not looking optimistic here with medium term price action continuing to move sideways at best, with an ominous breakdown brewing:
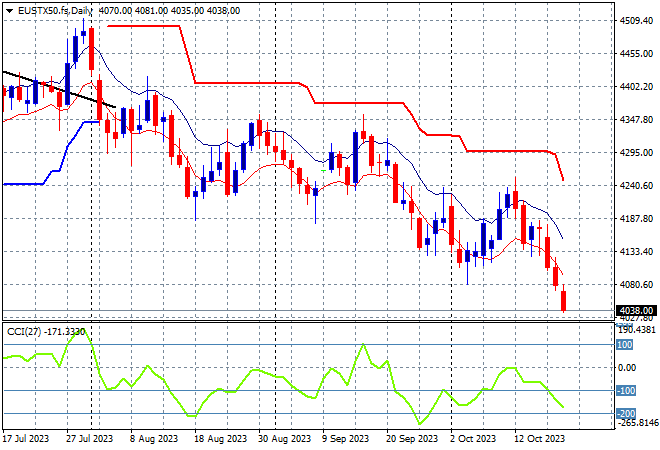
European markets remain unable to shake off the bad finish to last week with further losses across the continent with the Eurostoxx 50 Index losing more than 1.6% to finish at 4024 points.
The daily chart shows an overall decline with weekly support at 4100 points no longer defended, as weekly resistance firms at the 4300 point resistance level. There were signs the previous little bounce was running out of steam as daily momentum remained neutral at best, with a return to oversold settings now setting up further downside:
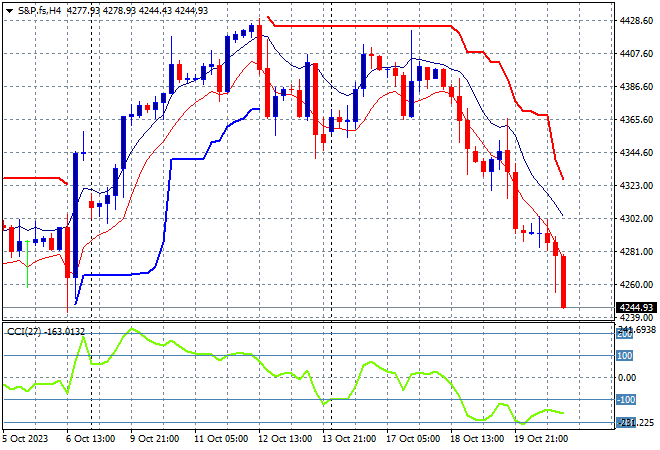
Wall Street also tore free from any semblance of an upside return with losses across the board with the Dow off nearly 0.9%, while the NASDAQ was the biggest loser, off by 1.5% as the S&P500 stumbled to a new monthly low, losing 1.2% to finish at 4224 points.
The four hourly chart showed support building at the 4340 point area with upside resistance still quite firm at last week’s high at the 4430 level before this selloff. Short term momentum remains in oversold territory as price action breaks down and pushes to a new monthly low:
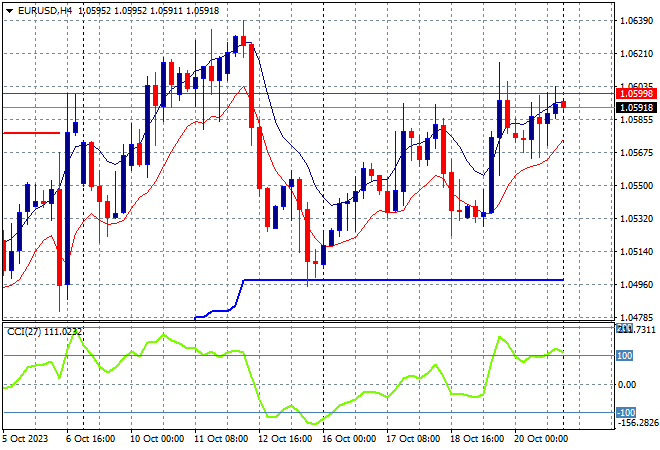
Currency markets again whipsawed somewhat on Friday night with King Dollar not going full safe haven as Euro regained strength to almost push back above the 1.06 handle.
On the four hourly chart the union currency is trying to break above short/medium term resistance at the 1.06 handle and while short term momentum remains slightly overbought there is resistance building here. Support at the recent weekly lows around the 1.05 level is relatively firm and well defended so far but this looks tenuous:
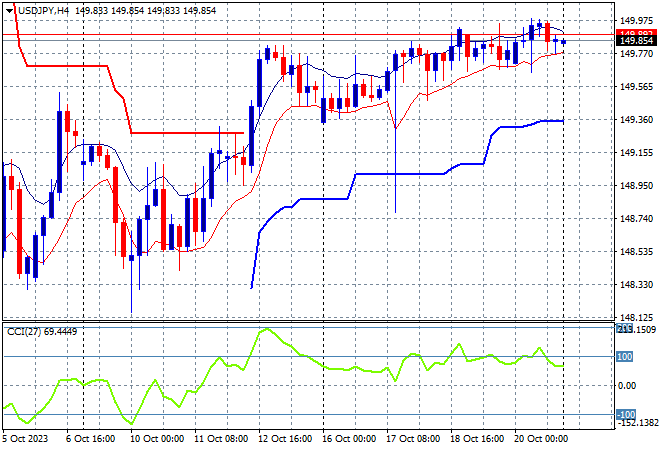
The USDJPY pair was able to hold onto its breakout above the 149 level but again failed to build further, not yet breaking through the 150 handle to push for a new weekly high after a recent successful test and rejection of last week’s low at the mid 148 level.
Four hourly momentum shows a return to overbought settings as it sets up for another attempt at getting through the 150 level soon:
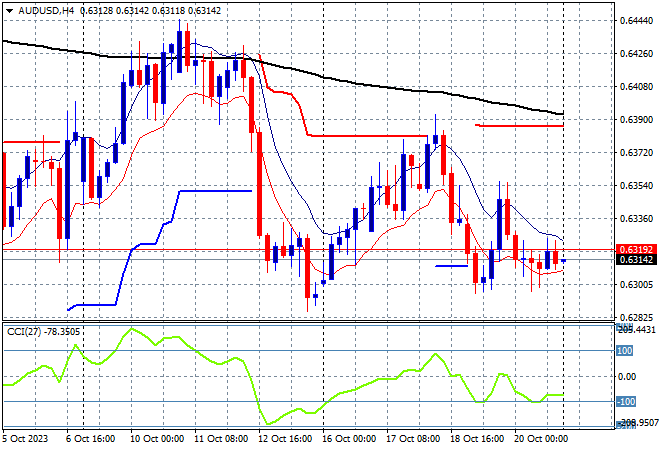
The Australian dollar had a strong bounce following the unemployment print but failed to hold on to those gains later in the week, dragged back to the 63 handle where it may find some volatility over the weekend gap this morning.
The Pacific Peso remains under medium and long term pressure with price action just not being translated into anything sustainable as the four hourly chart shows momentum returning to negative settings:
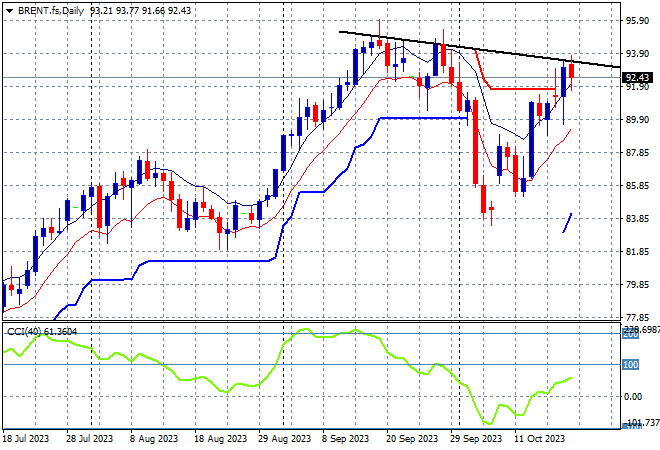
Oil markets shook off recent volatility and tried to break out again on Friday night, with Brent crude eventually pulling back to finish the week just below the $93USD per barrel level.
After almost reaching $100 in mid September, price was looking to return to the August levels around the $85 area where a point of control had been established before the recent breakout. Daily momentum is now above positive sessions with support clearly firming at those August levels so we could see a retest of the September highs at $94 plus soon:
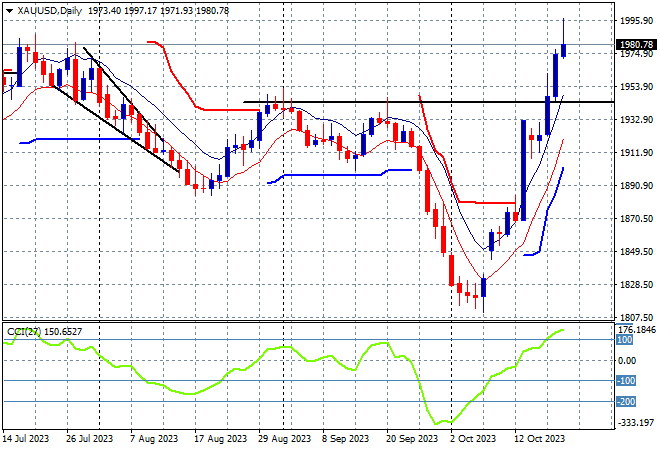
Gold remains the best undollar with another surge on Friday night as it leads the undollars, with a continued breakout above the $1900USD per ounce level, making another new monthly high at the $1980USD per ounce.
The daily chart shows quite a steep uptrend since the previous weekend gap higher as momentum remained very positive in the short term, trying to get back up to the $2000 level. This new breakout puts in a new monthly high with daily momentum now looking overbought and ripe for a pullback back to retest the $1900 level again, but so far no change as it builds above the $1970 level:
Glossary of Acronyms and Technical Analysis Terms:
ATR: Average True Range – measures the degree of price volatility averaged over a time period
ATR Support/Resistance: a ratcheting mechanism that follows price below/above a trend, that if breached shows above average volatility
CCI: Commodity Channel Index: a momentum reading that calculates current price away from the statistical mean or “typical” price to indicate overbought (far above the mean) or oversold (far below the mean)
Low/High Moving Average: rolling mean of prices in this case, the low and high for the day/hour which creates a band around the actual price movement
FOMC: Federal Open Market Committee, monthly meeting of Federal Reserve regarding monetary policy (setting interest rates)
DOE: US Department of Energy
Uncle Point: or stop loss point, a level at which you’ve clearly been wrong on your position, so cry uncle and get out!wrong on your position, so cry uncle and get out!