
Friday night saw the return of risk aversion across most markets in response to fears the Middle East woes will spread, with oil markets spiking and equities selling off on both sides of the Atlantic. The USD continued to recover with the Australian dollar having a quick peek below the 63 cent level as Euro returned to the 1.05 level.
US bond markets saw more flattening of the yield curve as 10 year Treasuries retraced to the 4.5% level, while oil prices spiked significantly after their recent retracement as Brent crude pushed back above the $90USD per barrel level. Gold was the standout with yet another strong breakout, breaking through the $1900USD per ounce level.
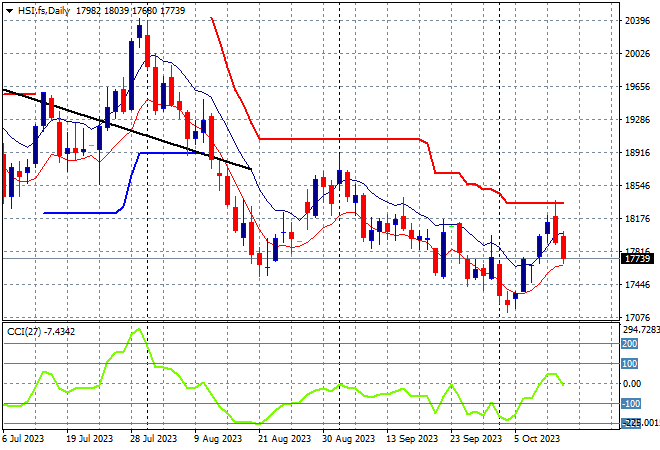
Looking at share markets in Asia from Friday’s session where it was fairly gloomy after a fairly positive trading week as mainland Chinese share markets retreated nearly 0.6% as the Shanghai Composite finished at 3088 points while in Hong Kong the Hang Seng Index took back most of its recent gains with a loss of over 2.3% to 17819 points.
The daily chart is still showing a significant downtrend that has gone below the May/June lows with the 19000 point support level a distant memory as medium term price action stays well below the dominant downtrend (sloping higher black line) following the previous month long consolidation. Daily momentum readings had gotten out of oversold mode but this bounce did not become a breakout, so my caution about it turning into a dead cat bounce is coming to fruition here:
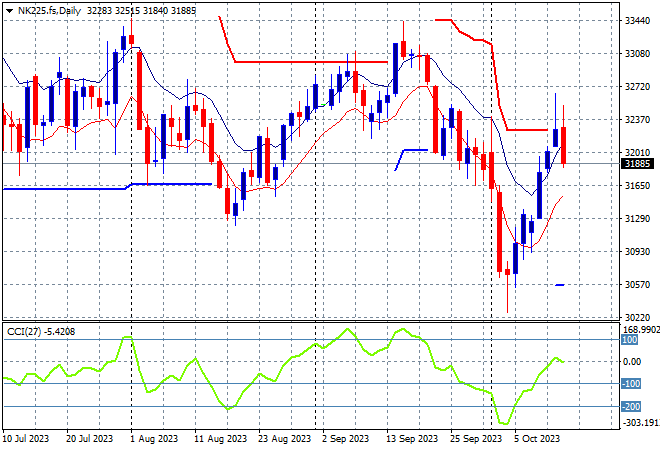
Japanese stock markets also pulled back on further risk aversion with the Nikkei 225 closing 0.5% lower at 32315 points.
Trailing ATR daily resistance was coming under threat in a very fast bounceback and while daily momentum retraced back from oversold settings price action is following Chinese markets with a typical dead cat bounce pattern forming here:
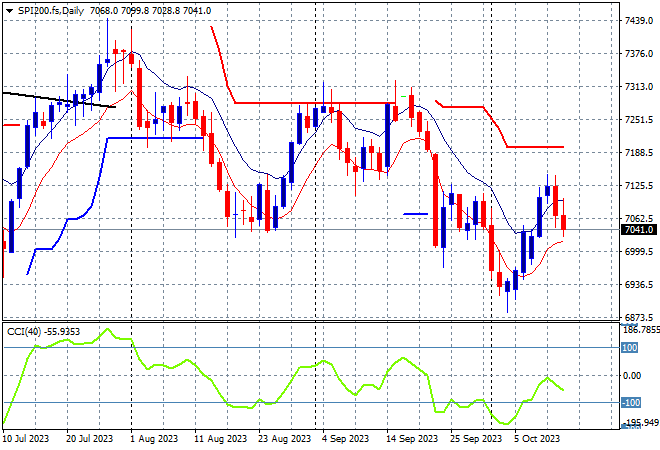
Australian stocks were also in sell mode with the ASX200 closing 0.5% lower at 7051 points.
SPI futures are down more than 0.4% in response to the falls on Wall Street on Friday night with the 7000 point level under pressure again to prove its either strong short term resistance or support. The daily chart is not looking optimistic here with medium term price action continuing to move sideways at best:
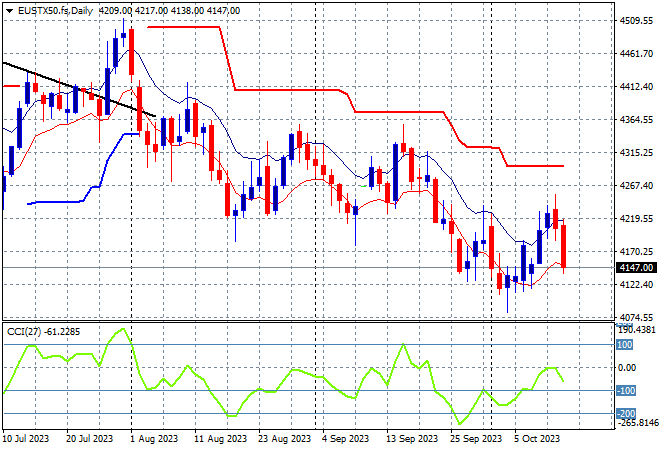
European markets also put in bad results to finish the trading week on a new low with the Eurostoxx 50 Index down 1.5% to end the week at 4136 points.
The daily chart still shows an overall decline with weekly support at 4100 points barely defended, as weekly resistance firms at the 4300 point resistance level. There were signs this bounce was running out of steam as daily momentum remained neutral at best and futures indicate more downside on the gap tonight:
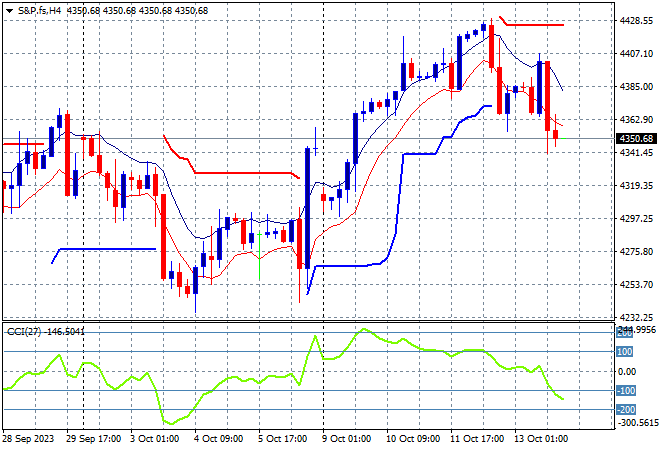
Wall Street not liking rising risk in the markets with losses across the three main bourses as the NASDAQ lost over 1% while the S&P500 retraced more than 0.5% finishing at 4327 points.
While the recent PPI print gave a late boost to the market with a clearance of the 4400 point area the subsequent CPI print saw that pulled back and more, down to the start of week position as interest rate worries continue to increase alongside macro concerns. The four hourly chart shows ATR support broken with short term momentum now well into oversold territory:
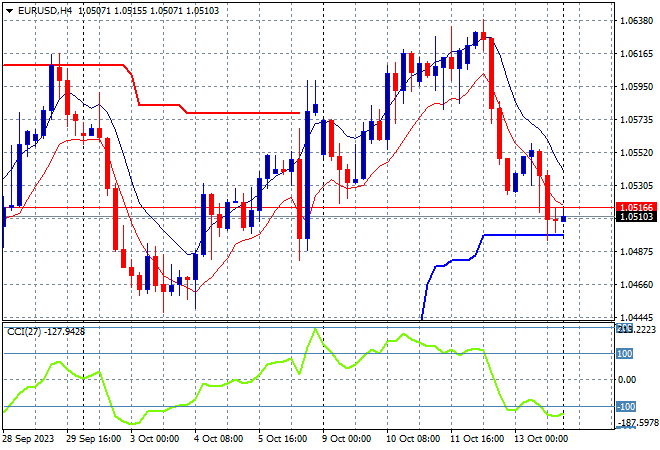
Currency markets have seen their recent fight back against USD thwarted in one fell swoop with the CPI print recently as King Dollar the further reasserted itself against most of the major currency pairs on the safe haven bid. Euro was one of the biggest hitters alongside Pound Sterling with the union currency returning back to the 1.05 level at its start of week position.
In the medium term its apparent on the four hourly chart that the union currency is wanting to break above short/medium term resistance at the 1.06 handle and while short term momentum was well overbought price action had started to bunch up and pause in preparation for the CPI print, falling sharply on its release. This could result in further losses back to the previous weekly lows around the 1.04 mid area:
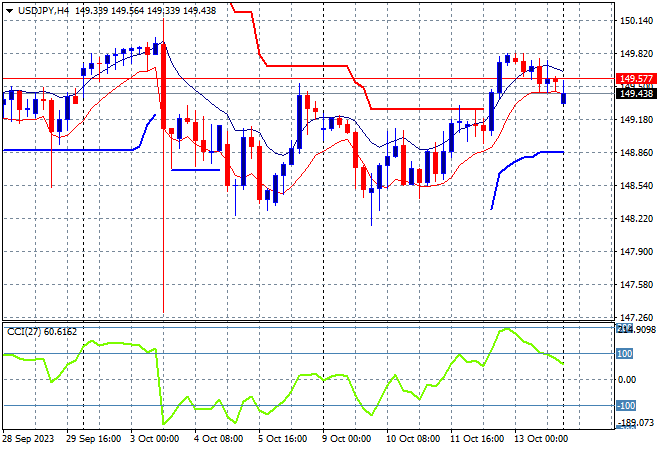
The USDJPY pair was unable to hold onto its breakout above the 149 level Friday night, almost making a new weekly high after a recent successful test and rejection of last week’s low at the mid 148 level.
Four hourly momentum shows a retracement from overbought settings so I expect some further moderation in today’s session but setting up for another attempt at getting through the 150 level soon:
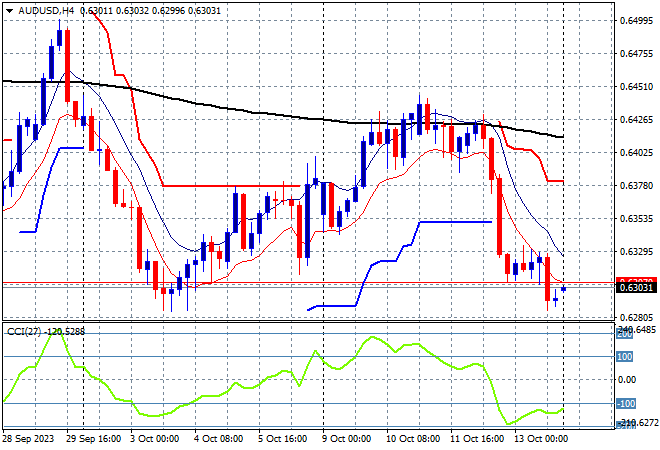
The Australian dollar was the biggest loser last week after stalling following the release of the FOMC minutes, with the subsequent US CPI print pushing it over the edge down to the 63 handle where it stayed Friday night after a brief look beow.
The Pacific Peso has been under medium and long term pressure despite the recent slow climb out of the doldrums that has now turned into an elevator ride as price action already had broken the low moving average on the four hourly chart, with oversold readings likely to continue into the new trading week so watch out below:
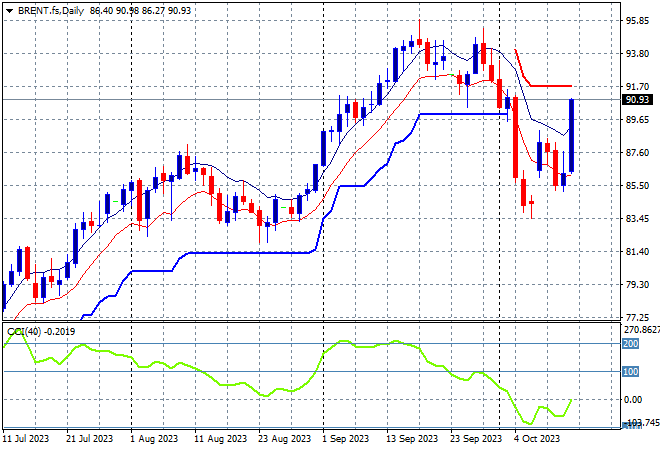
Oil markets lifted again on Friday night, putting aside fears of a dead cat bounce following the growing concerns of a wider conflagration in the Middle East. Brent crude eventually finished above the $90USD per barrel level, erasing all of its previous lossesl.
After almost reaching $100 in mid September, price was looking to return to the August levels around the $85 area where a point of control had been established before the recent breakout. Daily momentum is now back to neutral/nearly positive sessions with support clearly firming at those August levels so we could see a retest of the September highs instead:
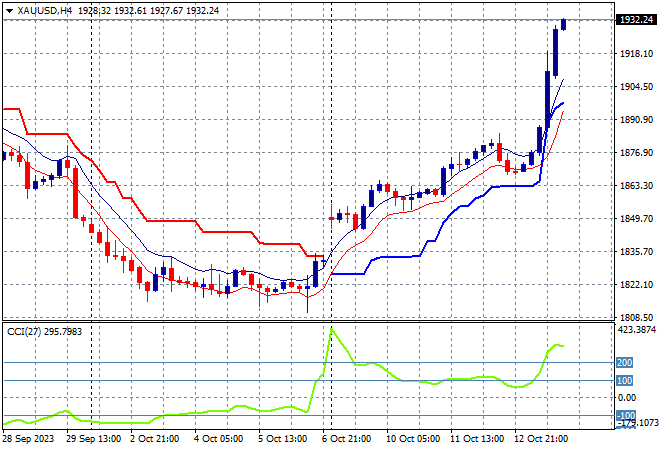
Gold was the best undollar and indeed risk-averse performer on Friday night with a huge breakout above the $1900USD per ounce level after absorbing the latest US CPI print with aplomb.
The four hourly chart was showing a very steady uptrend since the previous weekend gap higher as momentum remained positive in the short term. This new breakout puts in a new monthly high with short term momentum extremely overbought and ripe for a pullback back to retest the $1900 level again:
Glossary of Acronyms and Technical Analysis Terms:
ATR: Average True Range – measures the degree of price volatility averaged over a time period
ATR Support/Resistance: a ratcheting mechanism that follows price below/above a trend, that if breached shows above average volatility
CCI: Commodity Channel Index: a momentum reading that calculates current price away from the statistical mean or “typical” price to indicate overbought (far above the mean) or oversold (far below the mean)
Low/High Moving Average: rolling mean of prices in this case, the low and high for the day/hour which creates a band around the actual price movement
FOMC: Federal Open Market Committee, monthly meeting of Federal Reserve regarding monetary policy (setting interest rates)
DOE: US Department of Energy
Uncle Point: or stop loss point, a level at which you’ve clearly been wrong on your position, so cry uncle and get out!wrong on your position, so cry uncle and get out!