
Australian dollar another reason for Chinese to buy property
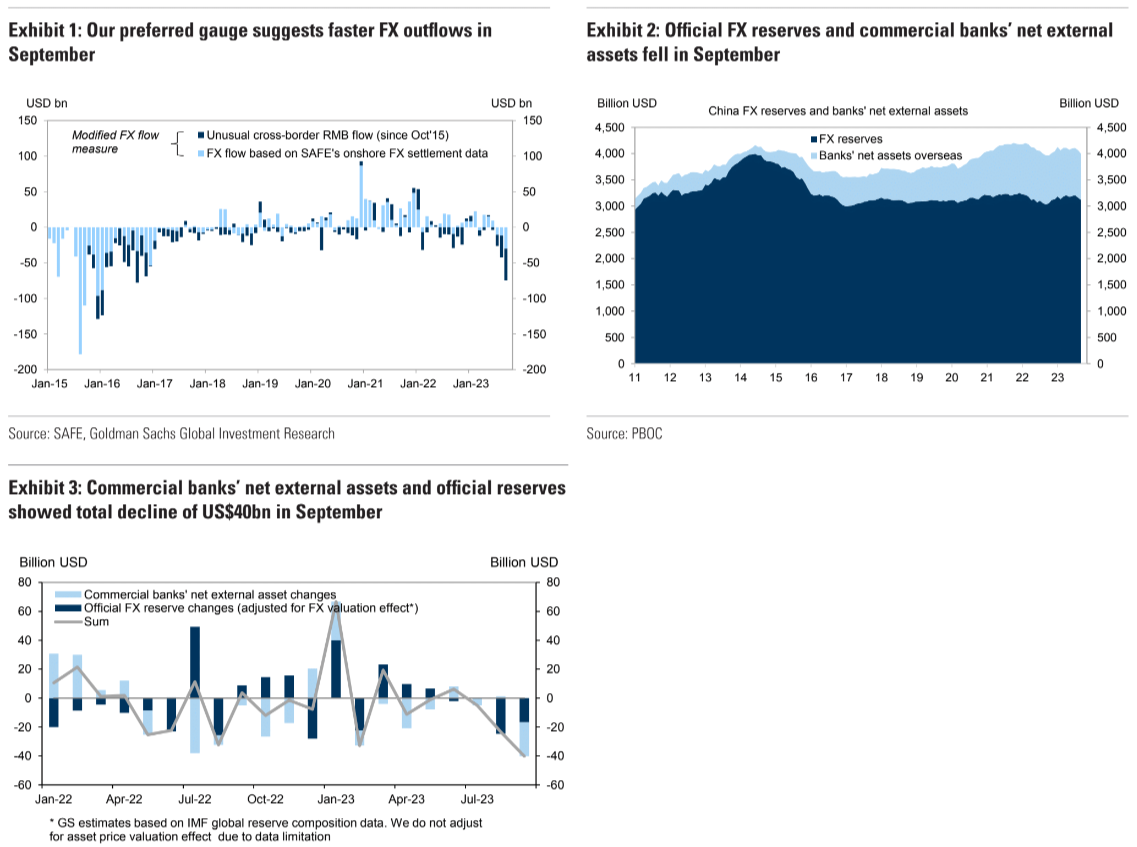
Goldman has a new note describing accelerating Chinese capital flight.
1. In September, we saw US$35bn in net outflows via onshore outright spot transactions, and US$5bn inflows via freshly entered and canceled forward transactions.
Another SAFE dataset on “cross-border RMB flows” showed outflows of US$45bn in the month, suggesting net payment of RMB from onshore too ffshore.
Our preferred FX flow measure therefore suggests a total US$75bn outflows in September, in comparison with US$42bn outflows in August (Exhibit 1).
2. The current account showed net outflows despite the elevated goods trade surplus.
We saw a net inflow of US$15bn related to goods trade in September, lower than the US$26bn in August.
Goods trade surplus conversion ratio fell to only 19% in September vs 38% in August, on the back of continued depreciation of the currency.
The services trade deficit widened to US$15bn from US$14bn in August.
The income and transfers account showed outflows of US$7bn in September, faster than the US$5bn outflows in August.
3. Portfolio investment channel saw continued but smaller outflows in September.
Stock Connect flows showed net selling of equities through northbound and net buying through southbound, which implies US$12bn outflows through the Stock Connect channel, vs US$22bn outflows in August.
Foreigners net bought US$2bn onshore bonds in September, in contrast to the continued selling in prior two months.
4. Official FX reserves (released earlier in the month) declined to US$3,115bn in September from US$3,160bn in August.
By our estimate, FX valuation effects would have cut FX reserves by US$28bn in September, so after adjusting for FX valuation effects, FX reserves still decreased by US$17bn in August.
The sharp moves in UST yields likely lowered FX reserves through asset price valuation effect as well.
Besides the official reserves, we noticed in our previous research that commercial banks’ accumulated net external assets from 2020 to 2021, which can serve as buffer for capital outflows as well.
In September, commercial banks’ net external assets went down by US$23bn, vs around US$1bn increase in August.5.
The authority continued to signal strengthening bias in the daily CNY fixing, and managed to keep USDCNY around 7.30 over the past one and a half months.
The unfavorable interest rate spread between China and the US will likely imply persistent depreciation and outflow pressures in coming months.
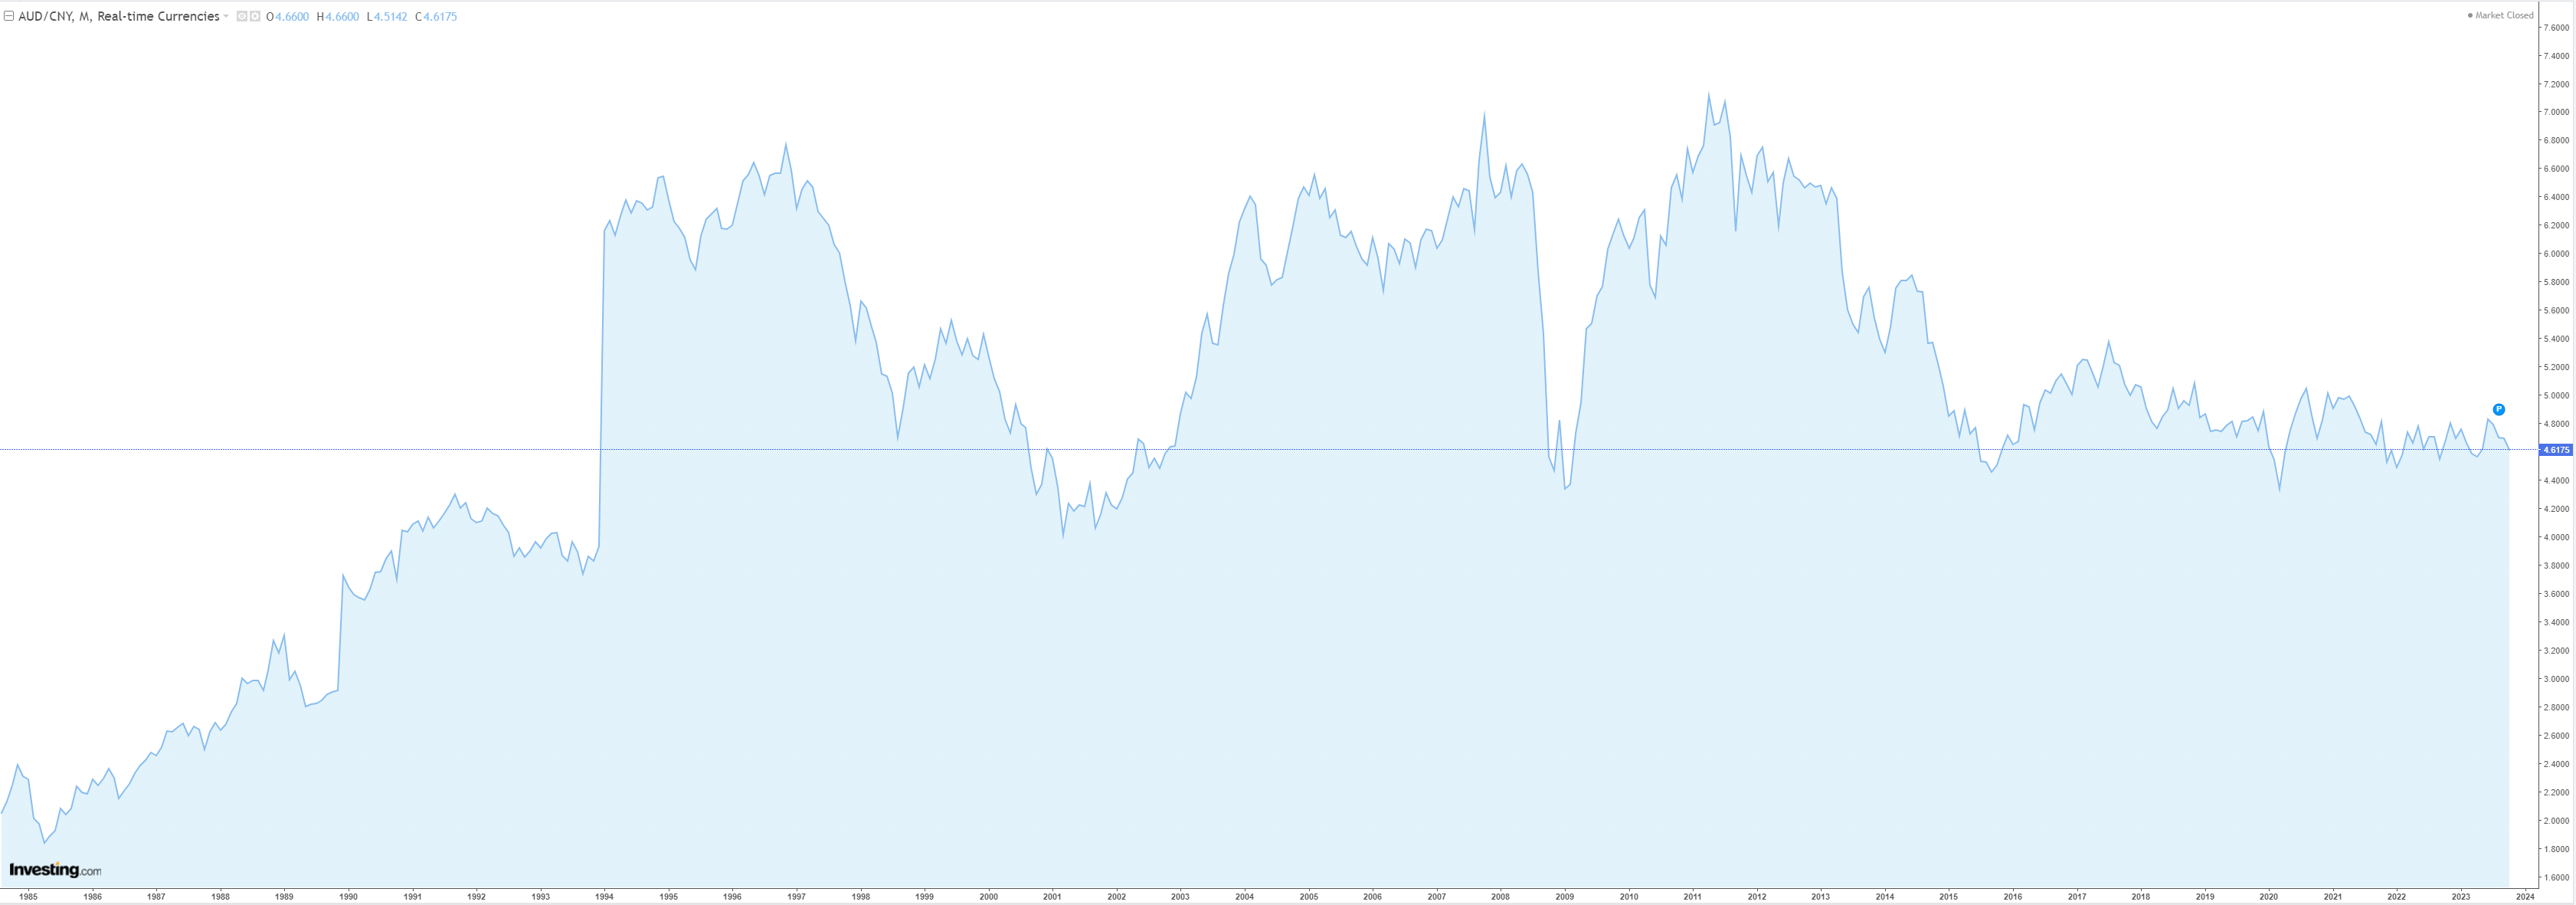
AUD depreciation against CNY is another reason mainland Chinese buy Australian property. Thankfully, and probably because Chinese economic weakness is structural, the AUD is also falling, limiting the forex appeal of the trade.
In fact, the AUD has been caught in a very tight range with CNY for the past eight years. Ever since the great iron ore bust of 2015, which was, perhaps, when markets first realised that the Chinese miracle was in trouble and so was Australia’s commodity dependence.
Let’s face it, successive governments have done nothing to wean Australia off the Chinese addiction, neither in terms of dirt exports nor illegal flows of capital into Australian property.
Only Beijing has aided priced-out and homeless Aussies by blocking many of the illegal avenues for capital flight. We can expect more of that to come.
We still can’t be sure how strong is the recent bid into Aussie property from offshore Chinese. Anecdata is strong, but the best guides we have are lagging and still showing a modest uptick:
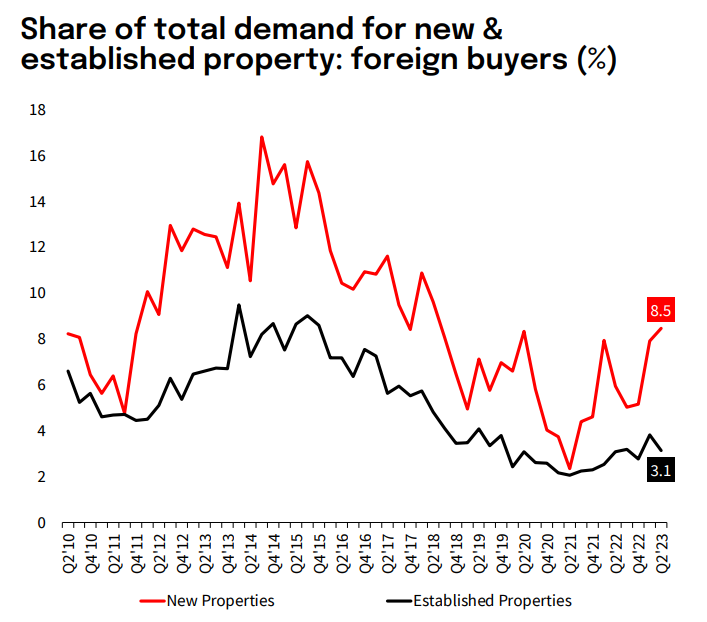
During Australia’s 2011-15 boom in Chinese property buyers, the AUD fell 40% versus CNY. This was the cherry on top of the rising capital values for foreign investors.
There is no such incentive this time, and, given CNY will keep falling (as well as AUD with it), it may even act as a deterrent.
Which is more than we can say for your government.
