CBA senior economist, Belinda Allen, expects the Reserve Bank of Australia (RBA) to keep the official cash rate on hold until 2024. She also believes that the hurdle to lift rates again is high.
However, there are still risks to the inflation outlook, including the evolution of prices, wages, the labour market, and consumer spending. In this note, Allen explains these risks and how they could force the RBA to hike again.
Key Points:
- The RBA last lifted the cash rate in June, we now expect an extended pause with the cash rate at 4.10%till 2024.
- The hurdle to hike again is high, but still present. The RBA are sounding more comfortable they will achieve an even keel.
- Key risks to interest rates in either direction will be the evolution of prices, wages, labour market and consumer spend data over the next six months.
- We expect rate cuts to commence in Q1 24 but the risks are to a later start date if economic data is resilient.
The RBA is sounding more comfortable an even keel will be achieved –what could knock them from this view?
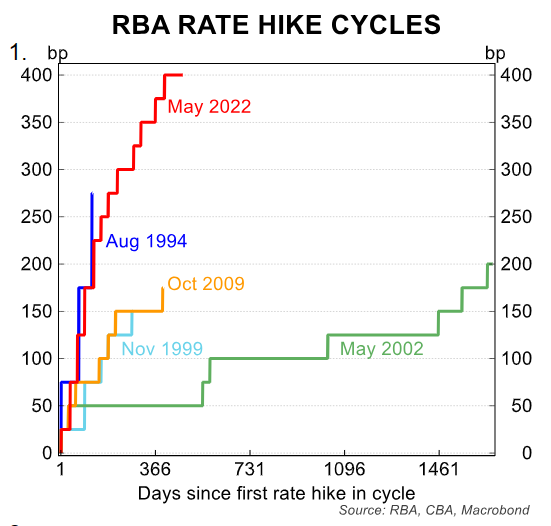
The Reserve Bank of Australia (RBA) lifted the cash rate by a material 400bp between May 2022 and June 2023 (chart 1). After two consecutive on-hold decisions, and growing evidence rate hikes are working, the debate has now turned to what could see the RBA lift the cash rate again, or conversely, what set of economic indicators could see the RBA begin to ease monetary policy.
In this note, we reiterate our base case scenario for the Australian economy and RBA cash rate. For reference we expect the RBA to remain on hold at 4.10% till an easing cycle commences in March 2024.
We outline key data and themes that could shift our base case view. Currently, the risks are two-sided and lie between another rate hike in the later stages of 2023, or a later start date to the easing cycle.
These scenarios though are not mutually exclusive. There could be a scenario where the RBA hikes again, but then reverses course quickly as the economic data unfolds. Governor Lowe nominated two key risks to the outlook in recent communication–household consumption and services inflation.
We discuss these in detail and broaden them out to include a discussion of wages growth, the labour market and productivity growth.
The cash rate is in restrictive territory at 4.10%
Before we turn to the risks either way for the cash rate, it is important to start with the current stance of monetary policy. At 4.10% we view the cash rate is in restrictive territory.
One way we have been assessing the stance of monetary policy during the hiking cycle is through the ratio of housing debt servicing costs as a share of income. As chart 2 shows as at Q2 23, scheduled mortgage payments increased to 9.4% of household disposable income.
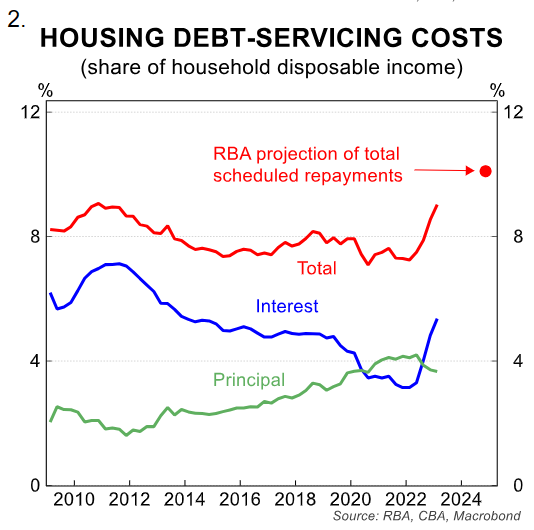
According to the RBA these payments are projected to increase to an historical high of around 9.8% of household disposable income by end of 2023 and to 10.1% by end of 2024, the highest on record, conditioned on the current 4.10% cash rate.
Governor Lowe in his testimony before the House of Representative Standing Committee on Economics on 11/8 noted “It’s clear that monetary policy is in restrictive territory, and it is working to establish a better balance between supply and demand in the economy” and “it’s really only been roughly this year where policy has moved into restrictive territory, and we’re still seeing the effects of that”.
Lowe went on to describe the RBA now being in the “calibration phase” after being restrictive territory for some time, and is now focussed on the monthly flow of data.
The cash rate does not need to be held in restrictive territory for a prolonged period. A cash rate held in restrictive territory for too long will cause growth and price outcomes beyond what is necessary.
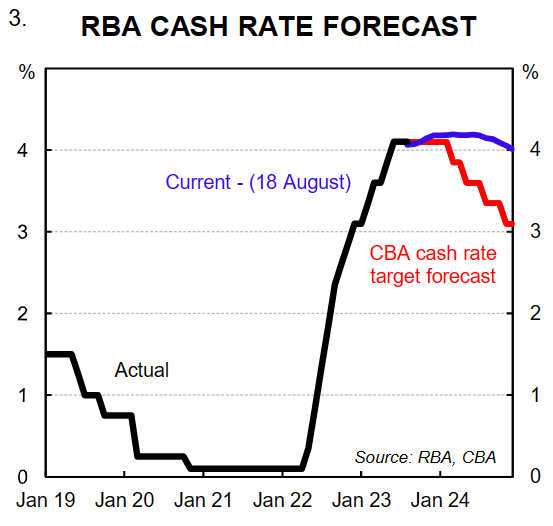
In Australia’s case, the cash rate has been above neutral for 8 months now and there is growing evidence that cash rate hikes are working as expected. We expect the cash rate to move back down to a more neutral level over time to ~3%. We expect this to occur by the end of 2024.Markets currently have priced little change to the cash rate (chart 3).
Our base case for the economy and interest rates
Following the RBA’s second consecutive on hold decision in August, we changed our base case view for the cash rate to remain at 4.10% for an extended period of time.
We noted at the time the hurdle to hike again is high. In recent communication the RBA sound more comfortable inflation is heading in the right direction. The rate hikes in May and June have now been characterised as insurance hikes against upside risks to inflation. And now evidence is building that rate hikes are working through a lower than expected Q2 23 CPI.
The August Board meeting minutes reiterated growing comfort in the outlook. From here we expect the RBA to remain on hold till Q1 24. We then expect at the 18-19 March meeting (under the new RBA timetable of 8 meetings a year instead of 11), the RBA to commence an easing of monetary policy as the economy slows, inflation moves back into target and the unemployment rate lifts.
In terms of economic outcomes, we expect Q4 23 GDP (data released in early March) to show a fall in annual economic growth to 0.7%/yr, from the 2.3%/yr recorded in Q1 23. We expect only flat to small positive GDP prints for the rest of this year, with growth mainly driven by business investment. Instead much of the slowdown will come from flat household consumption over the rest of 2023.
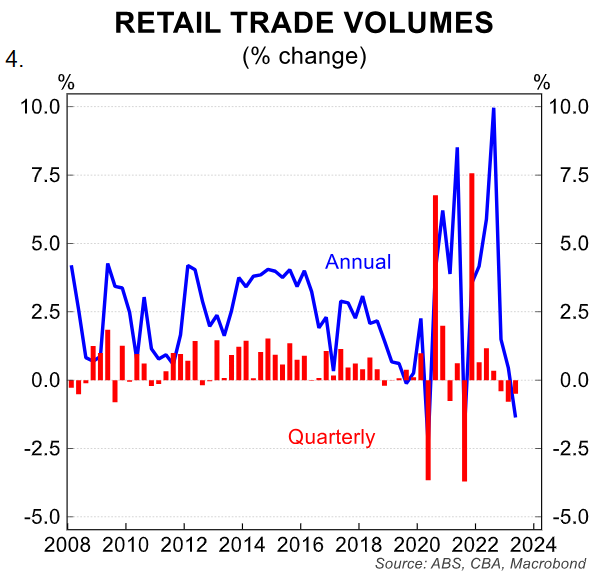
On current numbers the consumption side of the economy is slowing, as seen by a contraction in retail volumes of -0.5% in Q2 23 (chart 4). Consumption of goods has retreated, and so too has spending on discretionary items.
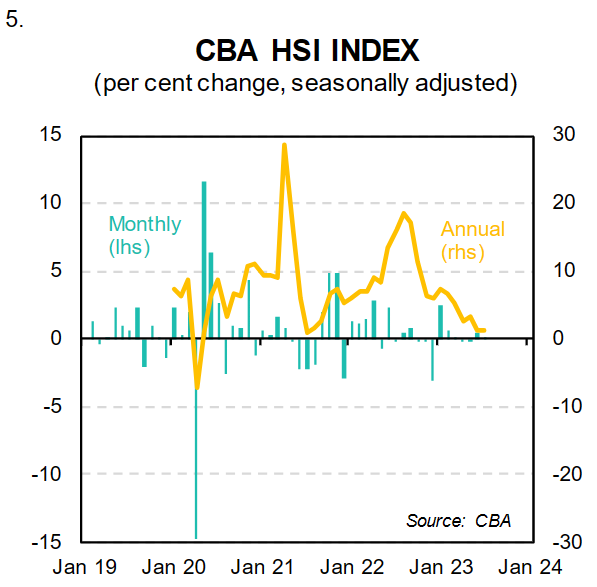
Our CommBank Household Spending Insights index, which captures total consumption in the Australian economy recorded nominal annual growth of just 1.3%/yr for July (chart 5). With inflation of ~6% and population growth ~2.5% it suggests negative volumes and a contraction in per capita spending has continued.
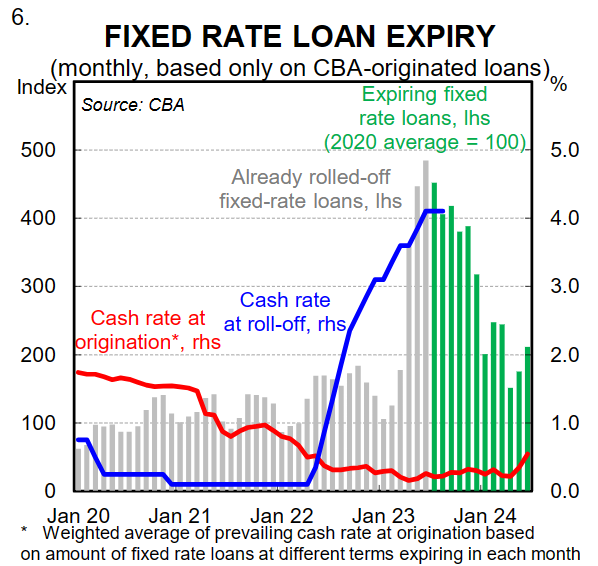
The impact on the consumer will continue to lift from here due to the lagged impact of rate hikes and the ongoing fixed rate roll off (chart 6).
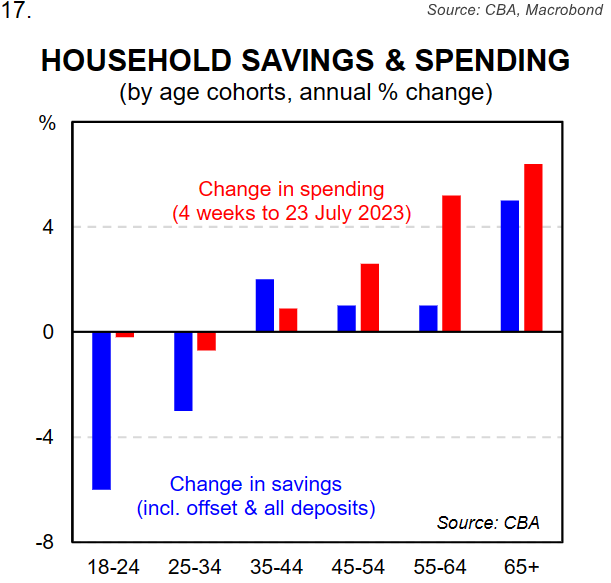
The impact on the consumer is diverse. Spending has contracted most in the younger age groups while held up in the older age groups. As we note later, one risk for the outlook for spending is the evolution of savings in the remainder of the year.
In terms of the rest of the economy. We expect dwelling investment to subtract from economic growth. But business investment and public spending should add to growth over the remainder of the year.
With the activity side of the economy slowing under the weight of interest rate hikes, we expect inflation to continue to move back towards target.
We expect the annual rate of inflation to be back below 4% by the end of the year. With further falls expected in 2024with headline CPI back below 3% in 2H 24.
We expect the labour market to continue to loosen from here with the unemployment rate reaching 4.2% in Q4 23and 4.6% in mid-2024.
Labour markets have been more resilient in our peer advanced economies than expected, as has been the case in Australia.
The resilience challenges both the view of what the non-accelerating inflation rate of unemployment is and the start date of rate cuts. More on this later.
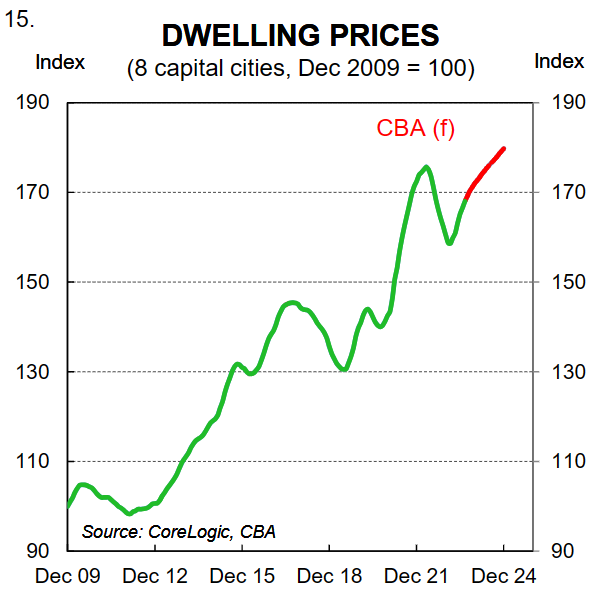
One key change to our base case view is around home prices. We had expected home prices to rise by 3% in 2023 and 5% in 2024. Our forecast for 2023 has already been met and we now expect a gain of 7% across the 8 capital cities in 2023 and a further 5% in 2024 (chart 15).
We will flesh out more thinking on this issue in the August home price data released on 1 September. This change in home prices forecasts is discussed again in the spending section.
Services inflation
The experience offshore has shown that services inflation can remain sticky for longer than goods inflation (chart 7).
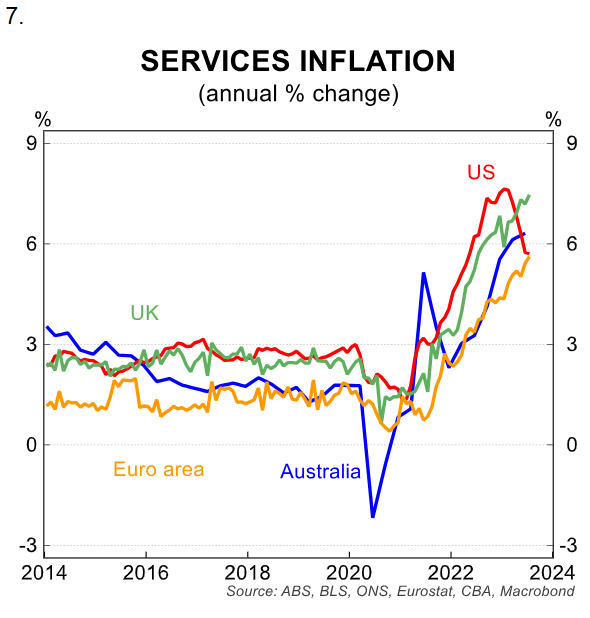
There are also signs in some peer economies of a wage price spiral, such as the UK. Strong demand for services, as well as higher input prices, including labour costs have driven prices higher globally and locally.
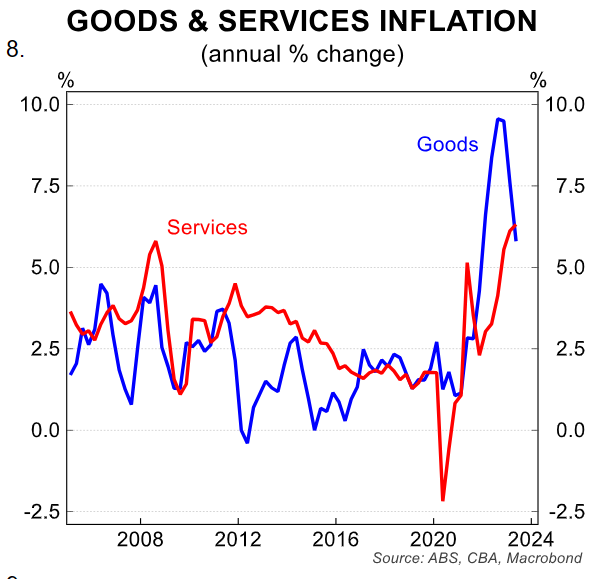
As at Q2 23 services inflation was 6.3%/yr in Australia (chart 8). In contrast goods inflation has retreated as supply chain disruptions normalise, shipping costs fall and demand for goods has eased.
The RBA is concerned that resilient demand for services, tight labour markets and weak productivity growth will see services inflation sticky. Services inflation and wages growth are closely tied.
The RBA has flagged persistent services inflation as one reason central banks could lift rates further.
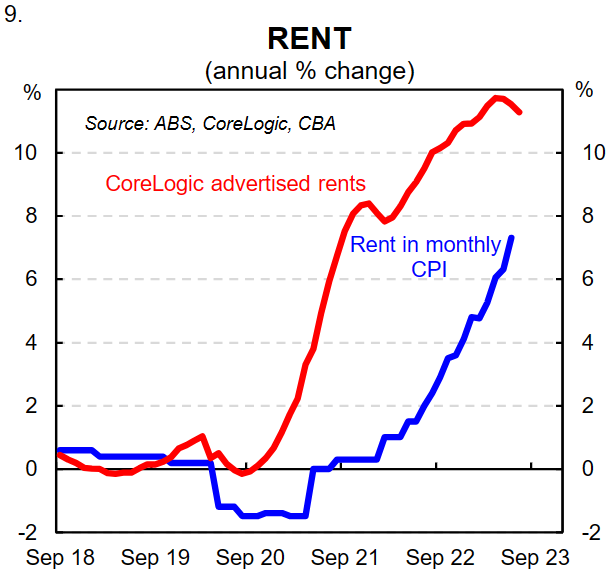
In Australia high services inflation is being compounded by rent inflation which the RBA expects to remain in the high single digits for a while yet (chart 9).
We expect services inflation to moderate from current high rates as the consumer slows under the weight of tight monetary policy and as wages growth remains below 4%. Compounding this is negative real wages growth in contrast to some other peer economies.
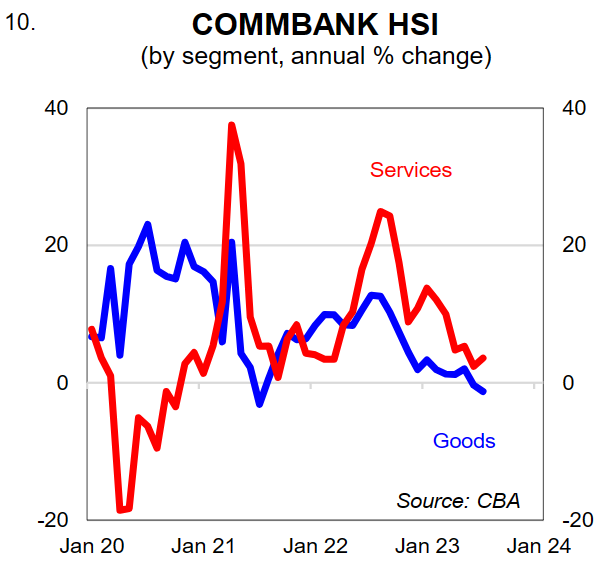
We have seen a slowdown in services spending in the CommBank HSI (chart 10). Although services spending still remains well above the pace of goods spending.
The interplay between services inflation, wages growth and consumption is important and we discuss these risks next. The next key data points for services inflation will be the July monthly CPI indicator on 30/8.
Rent is measured each month, as is travel, however other important prices are not. Prices including for restaurant meals, hair dressing, medical services and insurance are measured in later months of each quarter.
The next full read on services inflation will be for Q3 23 and released on 25/10. This release will see child care prices fall due to higher rebates and also volatility around electricity prices due to rebates.
We expect an upside surprise to the RBA’s inflation profile would be needed to suggest another rate hike is warranted. Based on the profile provided in the August Statement on Monetary Policy, a 0.9%/qtr lift in trimmed mean CPI appears to be the RBA’s forecasts.
Wages growth
One key risk for the outlook for services inflation is persistent and accelerating wages growth.
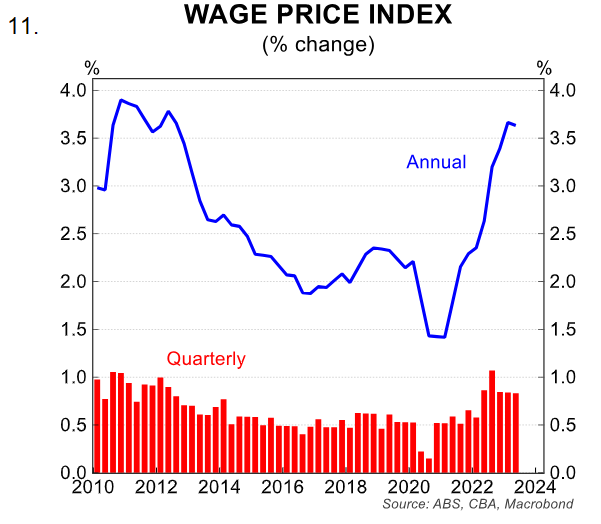
The Q2 23 Wage Price Index (WPI) data released last week came in softer than market and RBA expectations at 0.8%/qtr and 3.6%/yr. The annual rate actually decelerated (chart 11).
The RBA expects wages growth to accelerate to 4.1% over the second half of 2023 (chart 12). To achieve this outcome a large Q3 23 WPI print is required.
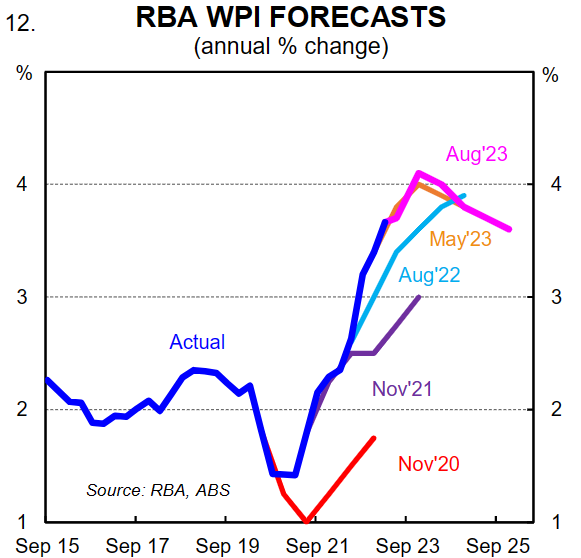
The RBA’s forecasts (released prior to the Q2 23 WPI) imply an expectation of a 1.4% lift in the September quarter, up from 0.8% in the June quarter and 1.1% in the September quarter 2022.
The expected acceleration in the quarterly profile is driven by two factors; the lift in the minimum and award wage decision on 1 July 2023, impacting ~11% of the wage bill. The lift this year was 5.75%, larger than the 4.6%-5.2% in 2022.
The second reason is driven by all the lift in minimum and award wages flowing through in Q3 23, unlike the staggered approach last year. See chart 13 for composition of wage gains.
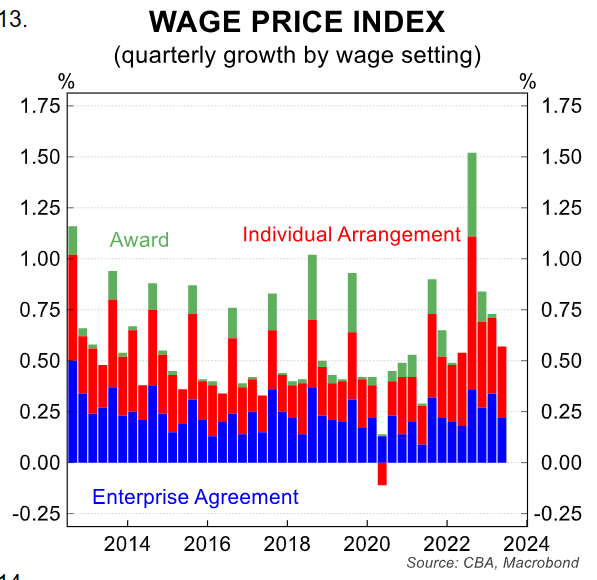
For the RBA to lift rates off the back of wages growth, we expect a stronger print than 1.4% would be required when the data prints on 15/11.
A stronger print would have to be driven by an acceleration in individual and enterprise agreement wages than currently is expected by us, and a larger pass through from award wages to other wages than the historical precedent.
The RBA currently notes this pass-through is around 10%. We find the hurdle high for the Q3 23 WPI print to exceed the RBA’s already high expectations. If it did it could prompt another rate hike late this year. There are mixed signals on the wage outlook.
Our internal CBA wage indicator has tracked sideways since early this year. The data to July does not yet show any material lift in wages growth.
We caution that the July figure is only a partial read on wage outcomes, but it provides some indication that wages growth is still consistent with the RBA returning inflation to target.
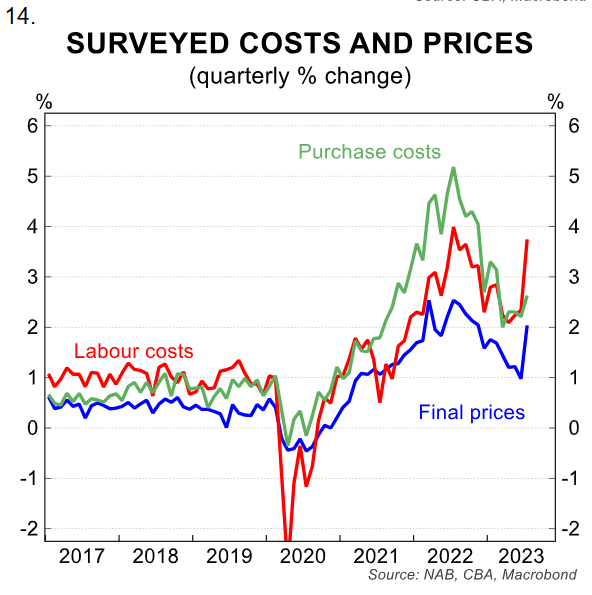
However if we are wrong, and instead we see wages growth print stronger than we expect, more in line with strength in the NAB labour costs series which bounced in July (chart 14), it could also see the RBA delay rate cuts beyond our current Q1 24 timing.
Much of this strength in wages though will come from how the labour market is performing at the time. As discussed below we expect the labour market to continue to loosen.
Consumer spending and savings
A case could be made for consumer spending to be stronger than we are expecting, or weaker over the next six months.
There are two key factors that could see more resilient consumer spending –the wealth effect from rising home prices and a larger draw down on savings.
Home prices have risen by 5% since the trough in February 2023. Historically, rising wealth provides incentives for consumers to spend more. Part of the home price story and the wealth effect also comes through higher housing turnover and renovation activity.
Currently there are very limited signs that these indicators are picking up. Australians accumulated a significant amount of excess savings over the pandemic period ~$A300bn (chart 16).
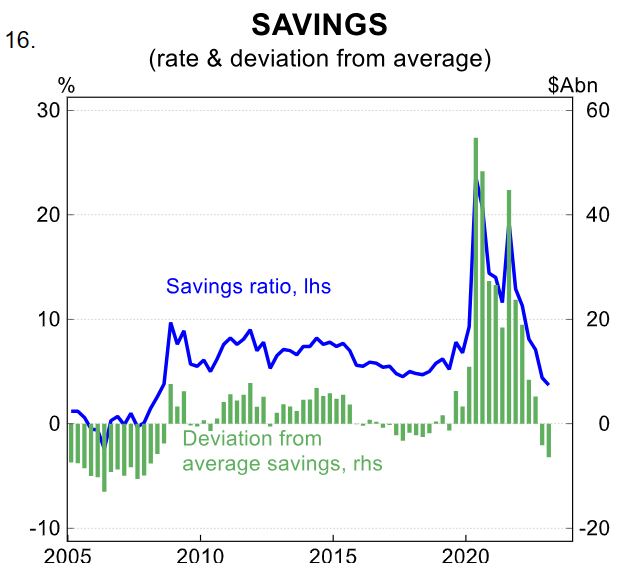
However these savings were not accumulated evenly by cohort. The bulk sits within the older cohort of society (chart 14) and those on a higher income.
In terms of the population size, those aged over 45 makes up ~ 42% of the population, compared to 15-44 of 40%. 0-14 year olds account for the remainder.
Any draw down of excess savings and corresponding pick up in consumption would have to be driven by the cohorts that saved in recent years. We expect this is unlikely to occur swiftly and to the degree needed to boost consumption enough to offset the drag in moderation by those heavily impacted by rents and mortgages going up. We have already seen this spending trend in CBA data (chart 17).
We continue to expect the savings rate to fall further. It was 3.7% in Q1 23 and we expect it to hit ~2.5% over the second half of this year as weak household disposable income continues.
Income tax payments, reduced social assistance, higher interest payments and possible lower salaries due to higher unemployment are expected to continue to place pressure on household disposable income.
In contrast, downside risks to consumption could occur for two reasons –the continued impact of higher interest rates and continued subdued household disposable income.
As of July, around two-thirds of the RBA’s cash rate moves have been felt by borrowers, this should lift to 85% by year end. Generally there is a three month lag between RBA rate rises and higher mortgage repayments, as well as between switching from a fixed rate loan to variable rate loan.
We are seeing this occur in CBA data as interest charged continues to rise. This will continue to impact on real household disposable income and we expect negative growth in Q2 23 and Q3 23 before a shallow recovery as inflation eases further.
The labour market
We have recently highlighted in several notes the resilience of the labour market, both here in Australia and other peer advanced economies has been a surprise.
Recent data and analysis by Stephen Wu suggests the labour market has been slowly loosening from very tight levels for some time. A labour market that remains resilient for longer could delay the expected start date of the RBA’s easing cycle.
The RBA expects the unemployment rate to reach 4½% by June 2025. We instead expect it to reach this rate a whole year earlier. If there are delays in the loosening of the labour market, due to labour hoarding, or more resilient economic activity, this could delay the start of the rate cut cycle from our current start date of March 2024.
Population growth continues to look strong and breaching forecasts provided in the May 2023 Budget. As chart 18 shows, the current pace of growth is closer to 500k, compared to the 22/23 forecast of 400k and 315k for 23/24.
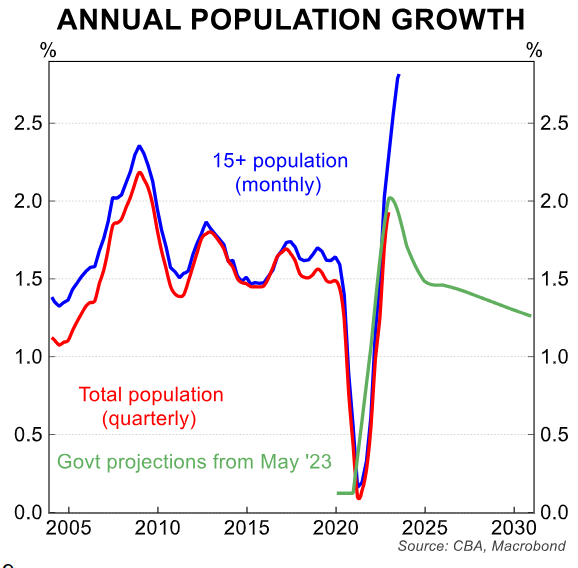
Revisions to the working age population could see a faster lift in the unemployment rate if labour demand does not shift higher also.
Currently approx. 33k jobs need to be added each month to keep the unemployment rate steady. Trend employment growth is sitting below this and we expect it to cool further.
If population growth stays higher for longer, this could see a higher lift in the unemployment rate, without a resultant shift lower in labour force participation.
Longer term -productivity growth
In recent months the RBA has doubled down on the importance of productivity growth and the flow through to upward pressure on prices through unit labour costs.
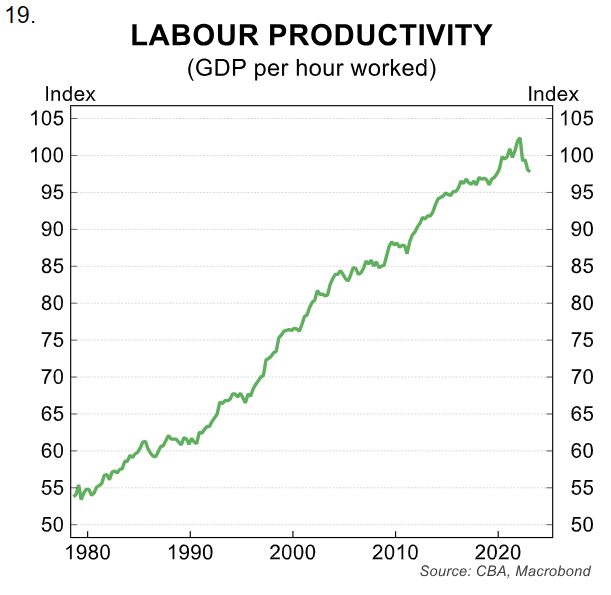
A pick up in productivity growth would contribute to slower unit labour costs and therefore inflation. The RBA is forecasting productivity growth will pick up closer to the rate prior to the pandemic.
Between 2010 and 2019 productivity growth averaged 1%. While in recent years productivity growth has been volatile due to the pandemic.
The RBA has noted that since 2019 there has been no improvement in labour productivity (chart 19). Strong employment growth since the pandemic and luck lustre investment spending over a longer period are contributing to this weaker productivity outcome.
The challenge though is data on productivity growth is released quarterly as part of the National Accounts data (next due 6/9).
It is likely that measured productivity growth will stay weak over coming quarters. There is a lag between slowing economic activity and rising unemployment and flow through to productivity.
And because of this we suspect productivity growth while watched closely by the RBA each quarter, given the lags and lack of timeliness in the data, measures of productivity growth are unlikely so shift policy decisions each month.
Instead productivity growth, and the size of any improvement is more likely to influence growth outcomes and the cash rate over a longer period of time.
A note on other factors
A number of other factors are often raised that can influence the RBA’s cash rate decision. The first is the level of the cash rate in Australia compared to offshore.
The RBA has raised this from time to time including in the August Minutes “the cash rate was notably lower than policy rates in other countries, despite inflation in Australia being at least as high” (chart 20).
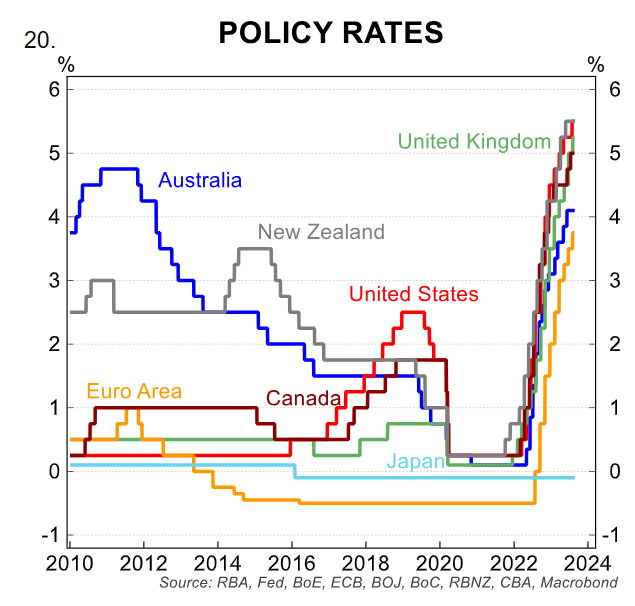
Lower wages growth and a faster pass through to highly indebted mortgage holders can explain the lower cash rate compared to offshore.
Australia’s budget position has also moved back into surplus in FY23 and could be balanced in FY24, in stark contrast to the US.
One other factor raised currently is the weakness in the Australian Dollar and whether this adds to inflation (chart 21).
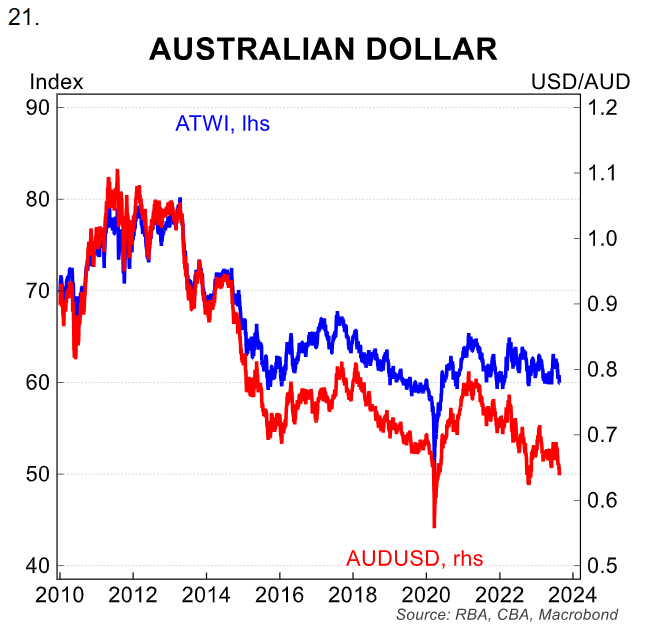
We have noted in past research the pass through from a lower exchange rate to CPI is weak.
The weak retail environment will also make it challenging for higher prices to be passed through to consumers.
