

Wall Street sold off overnight, pushed down to a one month low despite very solid US retail sales numbers with the USD remaining strong as commodity currencies continued to dive on the latest poor economic data out of China. The Australian dollar has been unable to get back above the 65 cent handle, now down at the mid 64 cent level.
US bond markets again saw a lift across the yield curve with the 10 year Treasury pushing above the 4.2% level on the retail sales print while oil prices pulled back sharply with Brent crude back down to the $85USD per barrel level. Gold briefly dipped below the $1900USD per ounce level and is barely clinging on there this morning.
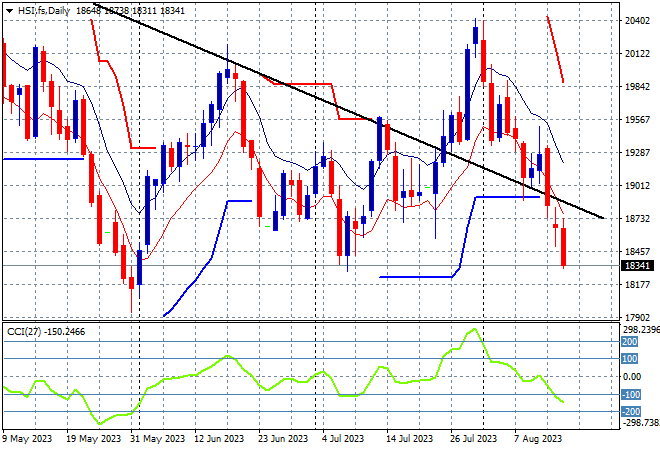
Looking at share markets in Asia from yesterday’s session with mainland Chinese share markets are continuing their selloff from last week although a late recovery saw the Shanghai Composite only lose 0.1% to finish at 3176 points while in Hong Kong the Hang Seng Index has fallen back 1% to 18581 points.
The daily chart was showing how the 19000 point level had become strong support as price action briefly went above the dominant downtrend (sloping higher black line) following a month long consolidation. This breakout was supposed to have had further legs but daily momentum readings have now retraced back to a negative level as confidence dissipates so watch for a more complete rollover here back to the June lows:
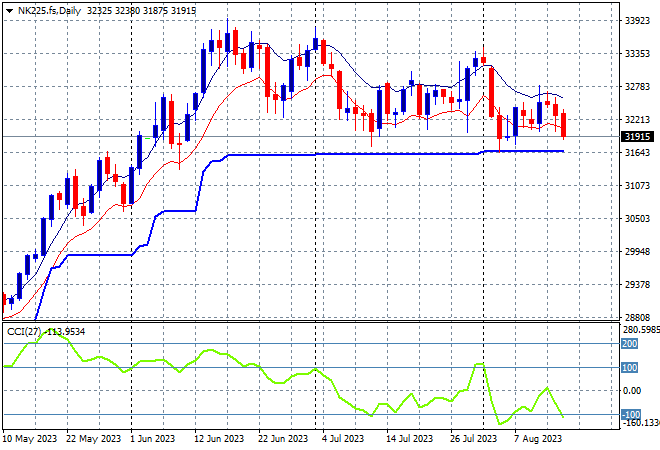
Japanese stock markets liked the GDP print and inflation numbers with the Nikkei 225 closing more 0.8% higher at 3238 points.
Trailing ATR daily support has paused for sometime now as the market has been going sideways after a big lift recently, with a welcome consolidation above that level. Daily momentum is getting out of oversold mode to neutral settings as price action is yet to break below the support zone, with a weaker Yen likely to help but still no activity just yet. Today’s GDP print could provide the catalyst:
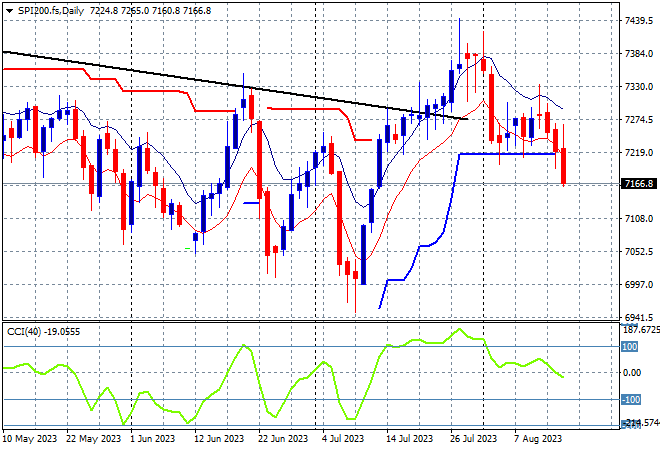
Australian stocks were able to make a modest lift in the end with the ASX200 closing 0.4% higher to be just above the 7300 point barrier.
SPI futures are down more than 1% this morning given the volatility on Wall Street overnight, so the 7300 point level will again be tested to see if it has truly firmed as short term support instead of resistance. Medium term price action was slowly getting out of its downtrend with the daily chart suggesting a breakout here as the June highs are bested but daily momentum readings have fully retraced from being overbought but not yet negative:
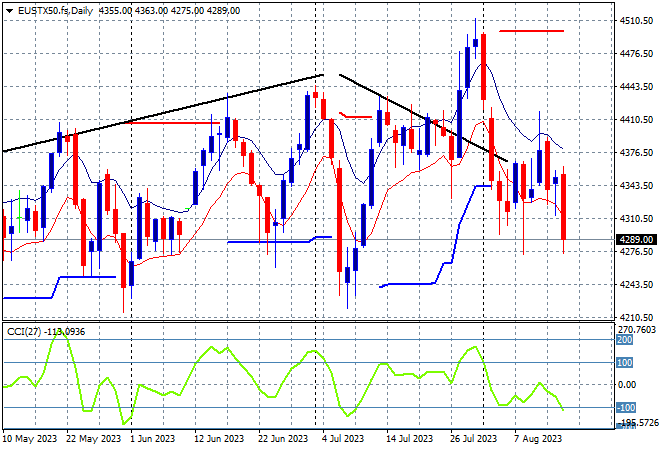
European markets are having another broad selloff as the Eurostoxx 50 Index slumped more than 2% lower to finish at 4288 points.
While the daily chart shows weekly support at 4200 points defended, weekly resistance at the 4400 point resistance level has now pushed the point of control well below the 4300 point level. There were signs of stability returning here but daily momentum is now going oversold so watch out below:
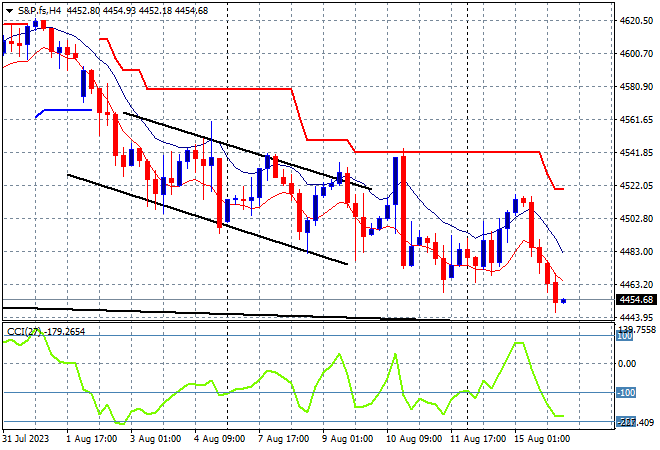
Wall Street was unable to gain any positive momentum at all and sold off through the session, with the NASDAQ and S&P500 both losing a little over 1% with the latter closing at a one month low at 4437 points.
The four hourly chart is continuing to show a downtrend channel since the NFP print last Friday night that still a long way to go to get back to the previous weekly high at the 4600 point level. Recent deceleration with a possible breakout brewing was a bull trap as the 4500 point level switches from support to resistance:
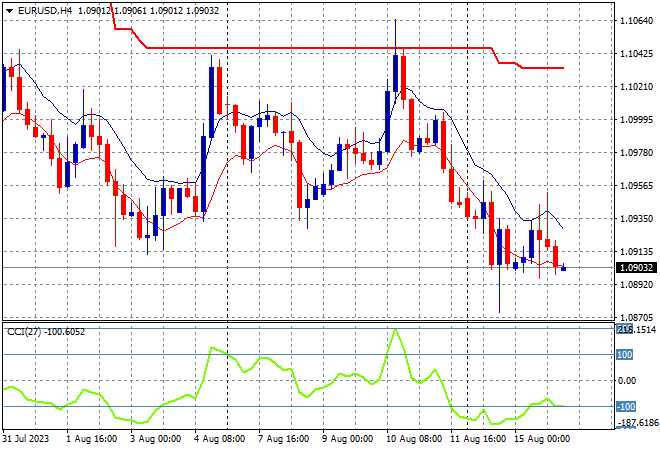
Currency markets remain enthralled to USD following last weeks US inflation prints with the retail sales number overnight pushing undollars back across the board, with Euro leading the way again down through the 1.09 level overnight.
Euro needed to have a strong return above trailing ATR resistance but failed despite a mid week rally to decline back to the previous weekly lows just above the mid 1.09 level. Short term momentum is now back to slightly oversold with price action suggesting a return to the start of August lows and possibly a crack below the 1.09 handle proper:
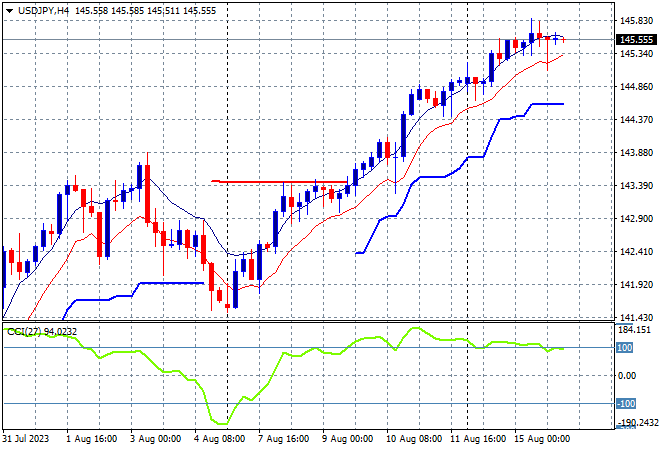
The USDJPY pair is still on an uptrend as it surpasses its previous weekly high with a continued series of positive sessions throughout last week, but this move is getting a little stretched at just above the mid 145 level.
Four hourly momentum had been slightly oversold but not overextended at the start of the week with price action taking back all of last week’s reflation rally in a very quick reversal. This has now been filled and then some as momentum becomes almost overbought and price surpasses the former highs which will act as the next level of resistance:
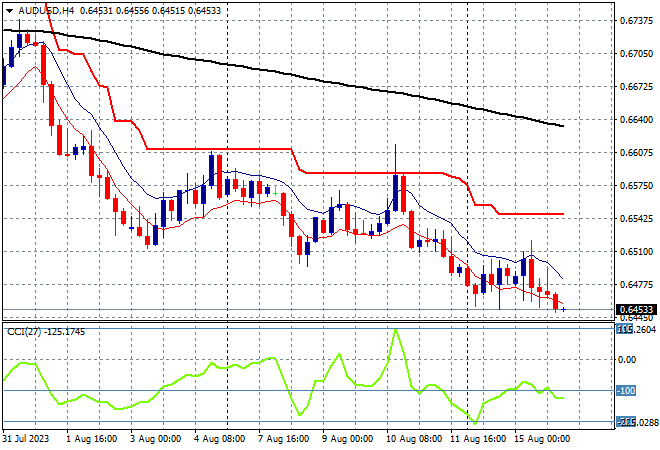
The Australian dollar remains under the pump against King Dollar with another down session overnight that saw it remain entrenched at its new weekly low below the 65 handle.
The subsequent price action from the previous Friday night’s bounce looked unimpressive from the start, confirming the weak mantle for the Aussie as ATR resistance and 200 EMA (black line) are still quite far away in both short and medium term trends. Watch for another potential rollover here as resistance is still too firm:
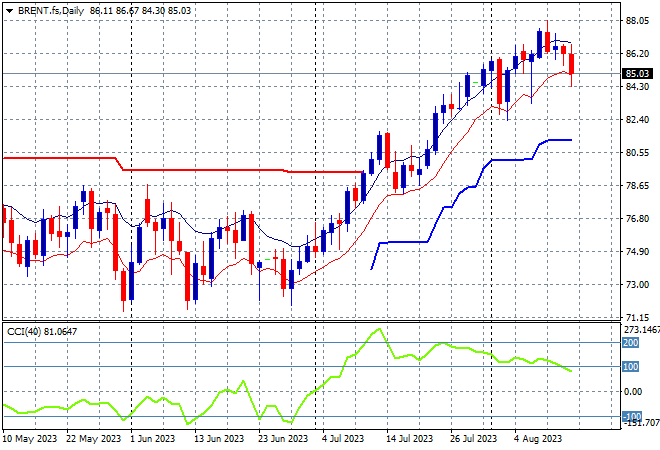
Oil markets had been relatively quiet with some moderation recently and this turned into a small selloff overnight with Brent crude pulled back to the $85USD per barrel level, keeping to its three month high and current uptrend.
Price had been anchored around the December levels – briefly dipping to the March lows – with the latest move matching the small blip higher in May and now putting aside resistance at the $80 level. Daily momentum has picked up strongly into overbought readings with price action now clearing the last couple months of resistance and continuing this uptrend:
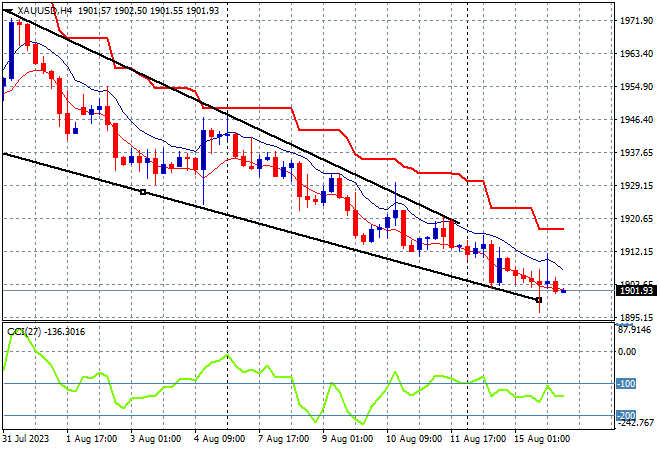
Gold remains in freefall with a rollover below the key $1900USD per ounce level overnight and no new session highs in what seems a one way trade.
The four hourly chart shows the attempt at getting back up to the psychologically important $2000USD per ounce level has been over for sometime now as the recent oscillations turn into a proper unwinding here down to $1900. Although this recent move is quite oversold and the chart pattern is now firming as a bullish falling wedge, so watch for a potential reversal:
Glossary of Acronyms and Technical Analysis Terms:
ATR: Average True Range – measures the degree of price volatility averaged over a time period
ATR Support/Resistance: a ratcheting mechanism that follows price below/above a trend, that if breached shows above average volatility
CCI: Commodity Channel Index: a momentum reading that calculates current price away from the statistical mean or “typical” price to indicate overbought (far above the mean) or oversold (far below the mean)
Low/High Moving Average: rolling mean of prices in this case, the low and high for the day/hour which creates a band around the actual price movement
FOMC: Federal Open Market Committee, monthly meeting of Federal Reserve regarding monetary policy (setting interest rates)
DOE: US Department of Energy
Uncle Point: or stop loss point, a level at which you’ve clearly been wrong on your position, so cry uncle and get out!wrong on your position, so cry uncle and get out!