Australia’s public housing provision has collapsed over the past 40 years.
The following chart compares the annual number of public homes built in Australia to private sector completions:
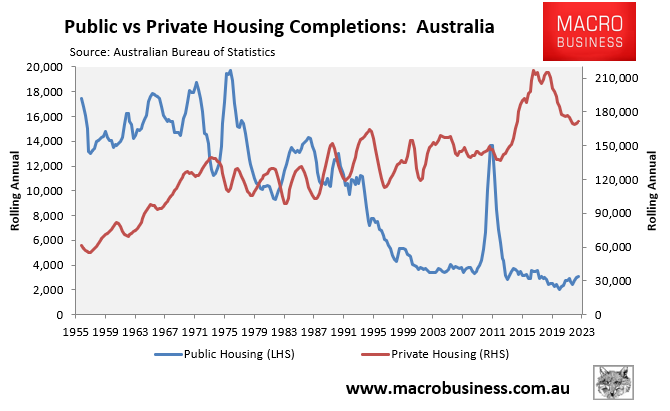
Australia built an average of 15,400 public housing units per year between 1955 and 1978.
Between 1979 and 1990, the average annual number of public housing units built was 11,700.
Between 1991 and 1999, the average annual number of public housing units built declined to 8,000.
So far this century, the average annual number of public housing units built has fallen to only 4,000.
When public housing construction is compared to overall new home construction, the picture becomes even worse:
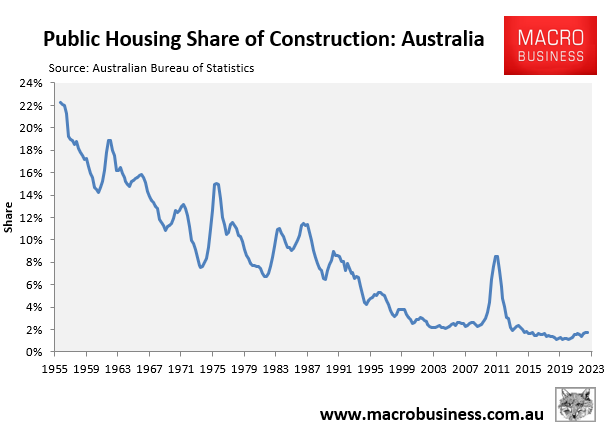
Public housing accounted for 22% of overall housing construction at the start of the series in 1955. However, by 2022, this had dropped to barely 2%.
The dilemma is exacerbated further when you consider that the federal government has significantly increased the population this century through mass immigration while public housing development has plummeted:
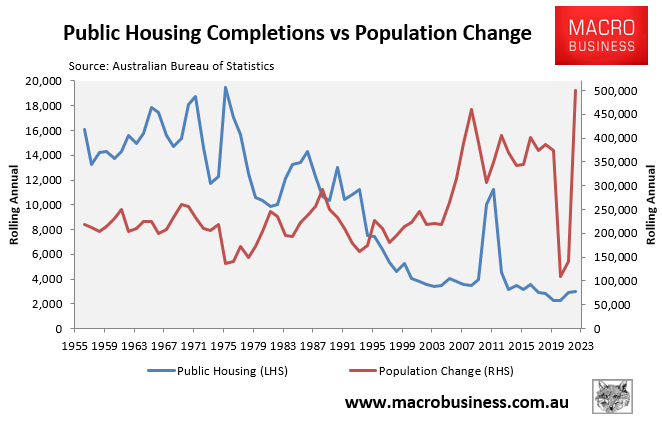
Here is a chart that compares Australia’s population growth to the construction of new public housing:
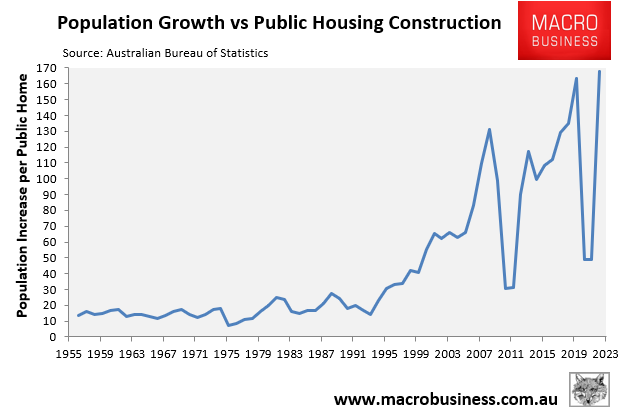
Between 1955 and 1993, Australia built approximately one public home for every 12 to 30 new Australians.
Over the following decades, the ratio of public housing to new Australians fell to a low of one home every 168 new Australians in 2022.
This deterioration is the direct result of a combination of the collapse of public housing construction and unprecedented volumes of immigration.
The situation was already destined to worsen given the federal budget projected record net overseas migration (NOM) volumes into the future:
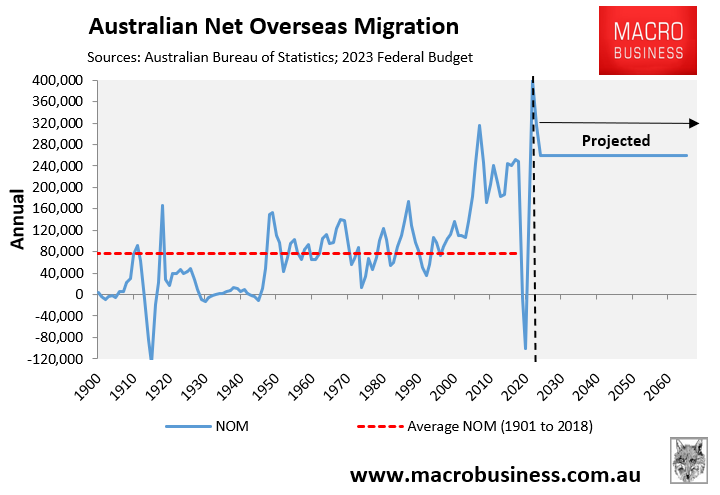
Specifically, the federal budget projected 400,000 NOM in 2022-23, 315,000 NOM in 2023-24, and then 260,000 NOM from 2024-25.
On Friday, the Albanese Government also announced that it would lift Australia’s humanitarian migrant intake to a record high 20,000, en route to a planned 27,000 humanitarian intake a year:
“With more people displaced worldwide than ever before, the Albanese Labor Government is stepping up to play its part in the global resettlement effort in a responsible way”, immigration minister Andrew Giles said in a statement on Friday.
The former Morrison Government decreased the intake to 13,750 places per year in 2020, although the number has gradually increased over time.
In the run-up to last year’s federal election, Labor promised to gradually increase the size of the humanitarian program to 27,000 persons every year.
About two-thirds of all refugees come from five countries: Afghanistan, Myanmar, Syria, South Sudan and Somalia.
Many will obviously require public housing, thereby making the shortage even worse.
Increasing immigration to record levels amid reduced investment in public housing is a recipe for disaster.
The impacts will be felt across Australia via soaring rents and rising rates of homelessness.
