
After a 5.25% rise in official interest rates and an 18% peak-to-trough fall in national home values, New Zealand’s housing market appears to be finally bottoming out.
Independent economist Tony Alexander explains in the note below.
Is the real estate market bottoming out?
Yes. In seasonally adjusted terms sales have improved about 19% in the past three months though history suggests this bounce up from the bottom should not be extrapolated. Such bounces do not last.
Also, average prices have been flat for each of the past three months, again in seasonally adjusted terms.
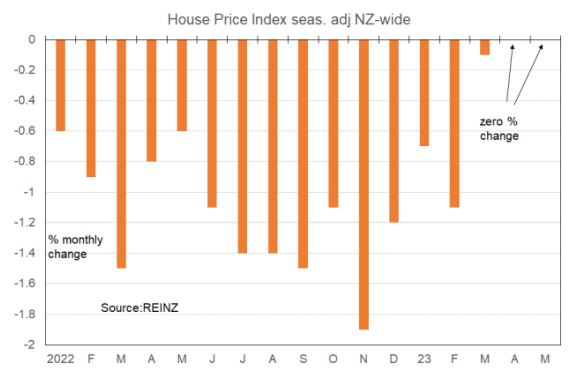
So, we can reasonably say that in the past 2-3 months both sales and prices seem to have stopped falling. Saying they are rising is something different.
Why is the downward leg of the cycle ending?
• Banks have recently been easing their lending criteria assisted by the Reserve Bank easing LVR rules and tweaking recently of CCCFA regulations.
• House prices are on average over 18% down from their peaks – more in Auckland – yet people have jobs and their wages have risen on average 17% since early-2020.
• Rents continue to rise.
• Stories of people losing their deposits on some new-build projects have encouraged buyers to revert to looking at listings for existing properties. Soaring construction costs have also driven a focus back on existing dwellings.
• There is a net migration boom pressuring the rental sector and growing awareness of the boom and how such surges in the past have affected the housing market.
• There is a view that interest rates have peaked (we’ll be right about this one day), so buyers can see their worst case scenario for financing costs.
• Over 200,000 migrants are in the process of having their temporary work visas transitioned to residency visas and therefore gaining the right to purchase a dwelling.
How fast will prices rise this year and through 2024?
The key point to note when considering how fast prices are likely to rise for the country, a region, a local authority area, suburb etc is this. No-one has shown an ability to reasonably accurately predict house price changes.
We economists will give you a forecast. But we’ll just pluck the numbers out of the air and actually prefer not to make such forecasts at all because we know how ridiculous they are.
Plenty of people believe that there is a rule of thumb whereby house prices double every seven to ten years.
But let’s say you believe that and the equation says the market peak is near so you might be thinking about selling off some of your rubbishy properties. You’re not going to blindly sell without considering what the indicators of housing market strength are showing. You’ll look at inflation and interest rate pressures, migration flows and so on rather than blindly adhere to a formula.
There may well be 7-10 year cycles in place for large parts of the country. But all that these “calculations” are really saying is this one simple thing when it comes to growing your wealth from holding housing assets. You hold for as long a period of time as possible and arrange your cash flow affairs with just one objective in mind – not being forced to sell when the market might be weak. Property investing is actually very easy.
Buy. Maintain acceptable cash flows. Focus on your personal abilities, family goals etc. Hold as long as possible.
Still, what looks likely for average house prices this year and next? I expect rises. Let’s guess 5% annual gain come the end of this year then 10% next year. What factors will contribute to house prices rising?
• Record net migration inflows (ignoring the initial pandemic surge).
• Rising rents.
• Rising income and saved deposits.
• Easing lending criteria imposed by banks, the Reserve Bank, and government.
• Rising chance of a change in government in October and reintroduction of tax rules encouraging provision of rental accommodation.
• Rising tourist inflows leading investors to switch to servicing foreigners rather than providing long-term accommodation.
• Declining volumes of new house construction with a flow of stories of builder collapses and buyer loss of deposits causing people to increasingly switch to buying existing properties. Developments in popular suburbs however will continue to be well supported.
• Activation of a queue of delaying buyers building up since early-2021.
What factors will restrain the pace of price rises?
• Rising unemployment – though probably not above a 5% rate.
• Interest rates only slowly declining.
Will stock availability improve much as vendors step forward?
I don’t think so.
More vendors will step forward to finally sell their property after stepping back from the market since the end of 2022 because of the dearth of buyers and not needing to sell. But buyers should not get optimistic about a rush of sellers.
The following graph shows the annual number of dwelling sales as the dark blue line measured on the left side. Note the pandemic surge, the collapse over 2021-22, and the bottoming out now evident. The orange line shows the three month rolling average number of fresh property listings received by real estate agents each month.
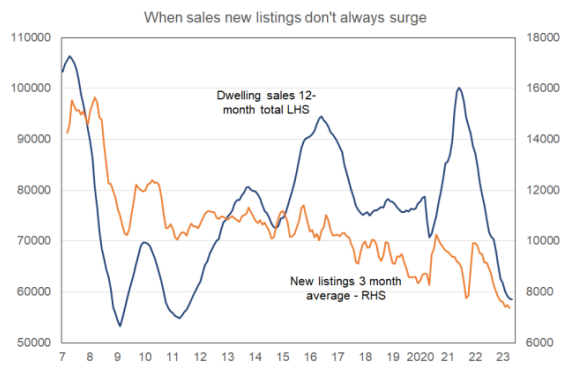
From 2007 to 2012 the two series tended to move together. But since a decade ago new listing numbers have trended down despite surging sales from 2015 into 2017.
The correlation restored during the pandemic – but then all graphs of things like this moved strongly over this period of time and we have to be careful not to over-interpret and extrapolate things we think we see from 2020 into 2022.
The graph shows new listings trending down. I expect they will rise as sales go up this year. But I question how strong the rise will be.
This next graph again shows annual dwelling sales as the dark blue line measured on the left side. The orange line shows the end of month inventory of listings on the realestate.co.nz website. This number is measured upside down on the right side.
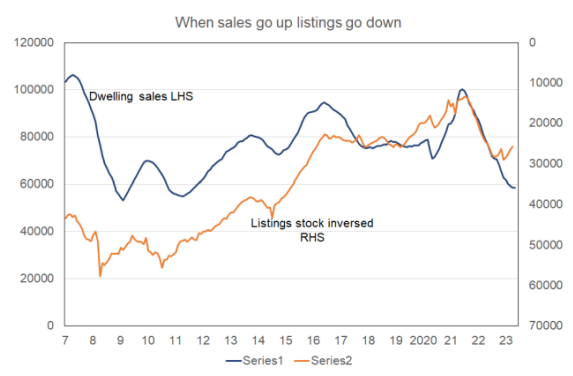
What happen when sales go up? The orange line visually rises which means numerically it gets smaller. Rising sales tend to lead to a falling stock of listings for buyers to choose amongst.
I like to highlight this information on listings developments because I believe it was a record low number of listings in the middle of 2021 which caused the return of FOMO and newly soaring prices in the second half of that year in spite of rising mortgage rates, net migration outflows, tightening lending rules, and tax changes hitting investors.
