The New Daily’s Michael Pascoe posted an article earlier this week arguing that Australia’s housing crisis has been caused by a sharp decline in public housing investment over many decades.
“The “gradual” part of the crisis started half a century ago when governments began to withdraw from providing public housing”, Pascoe wrote.
“That gradual withdrawal turned into a speedy exit since the turn of the century, finally disastrously exploding under the cover of COVID as the nation found itself with a critical shortage of accommodation and an unsustainable model of housing prices forever dramatically rising”.
“That’s where the missing housing is – the necessary public housing not built, the public housing that would have moderated housing and rent inflation, potentially keeping all housing more affordable”.
“Leaving the provision of shelter to “the market” – as the extremely powerful developer lobby and neoliberal ideologues have wanted – has demonstrably failed”.
After reading Pascoe’s article, I decided to examine the Australian Bureau of Statistics’ data on public housing provision.
The next chart plots the annual number of public homes built across Australia versus private sector completions:
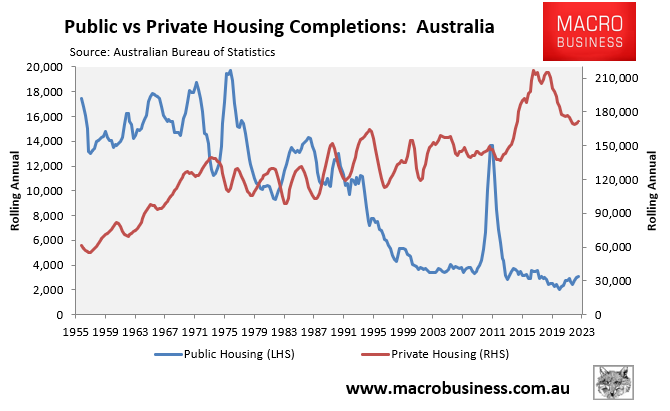
Between 1955 and 1978, Australia built an average of 15,400 public homes per year.
Between 1979 and 1990, the average annual number of public homes built fell to 11,700 per year.
Between 1991 and 1999, the average annual number of public homes built fell further to 8,000 a year.
And so far this century, the average annual number of public homes built has collapsed to only 4,000 a year.
The picture is even worse when public housing construction is compared against total dwelling construction:
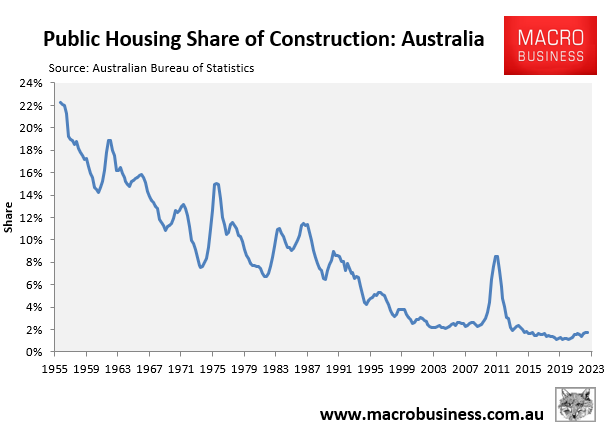
At the start of the series in 1955, public housing comprised 22% of total housing construction. But this had collapsed to only 2% in 2022.
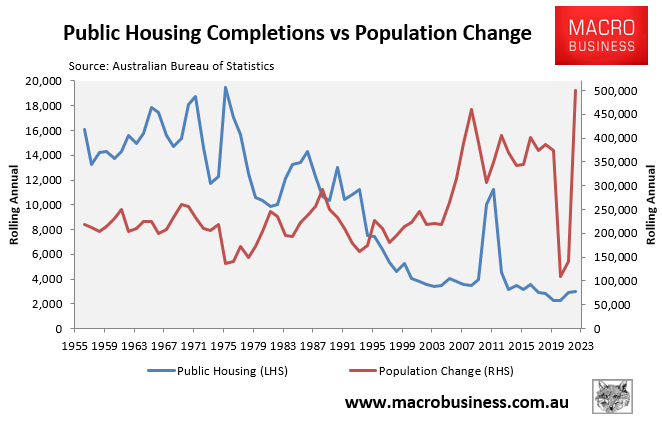
The situation is worse again when you consider that the federal government has rapidly expanded the population this century via mass immigration at the same time as public housing construction has collapsed:
Finally, here’s a chart plotting the ratio of Australia’s population increase against the construction of new public homes:
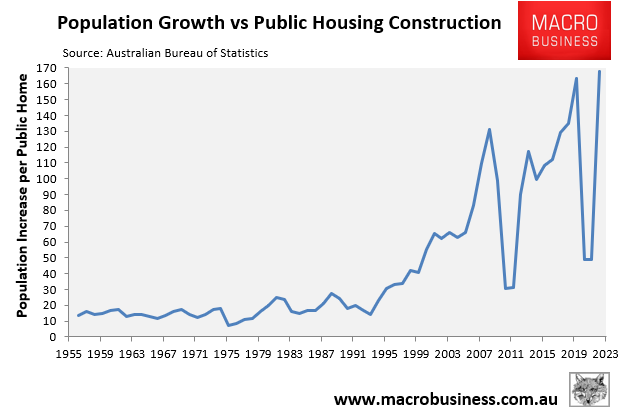
As you can see, Australia built roughly one public home per 12 to 30 new Australians between 1955 and 1993.
Over subsequent decades, the ratio of public homes to new Australians has deteriorated to a low of one home per 168 new Australians in 2022.
This deterioration reflects a combination of the collapse in public home construction and record levels of immigration.
Ramping up immigration to record levels at the same time as governments have reduced investment in public housing is a recipe for disaster.
The impacts are being felt across Australia via soaring rents and rising rates of homelessness.
