

Wall Street slumped after the long weekend pause despite a big lift in housing starts that was overshadowed by a drop in the Philadephia services index. European markets continued their own retracement as ECB central bankers remained cautious about the current trajectory of inflation.
US bond markets reopened as well with a drop in yields across the curve as the 10 year finished at the 3.7% level with oil prices off by more than 1% as Brent crude finished at the mid $75USD per barrel, just below its recent weekly high. Gold deflated yet again as it flopped well below the $1950USD per ounce level for another new weekly low.
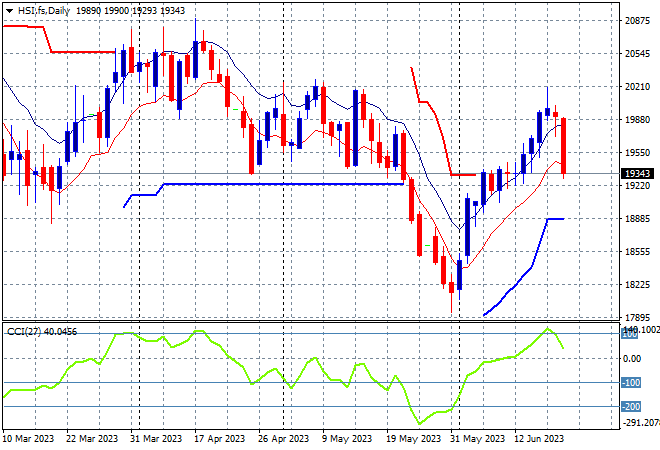
Looking at share markets in Asia from yesterday’s session where mainland Chinese share markets were down all session with the Shanghai Composite losing 0.4% to revert back to the 3240 point level while the Hang Seng Index sunk more than 1.5% lower to remain well below the 20000 point level at 19607 points.
The daily chart was showing a series of strong sessions that took it back above the previous resistance zone as daily momentum became positive and overbought, retracing most of the May losses. However yesterday’s session is showing a sharp reversal here back to that zone so watch for a follow through below the 19000 point level:
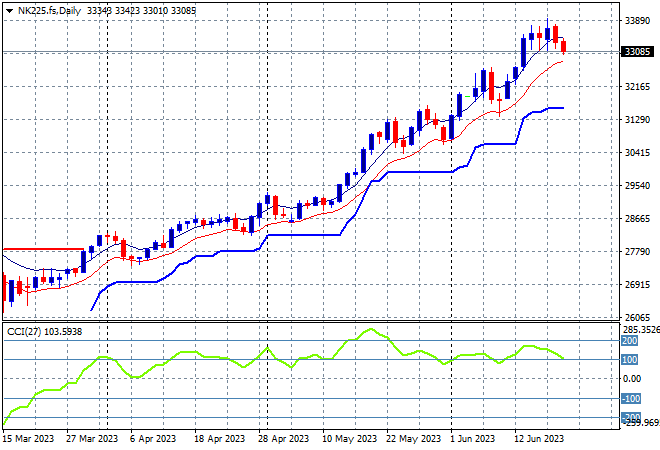
Japanese stock markets had another breather with the Nikkei 225 down initially before recovering for a scratch session at the close to finish at 33388 points. Futures are indicating another flat start due to the falls on Wall Street, but that daily chart looks impressive still.
Trailing ATR daily support keeps ratcheting higher as the 33000 point level is now breached with daily momentum still quite above overbought settings as this market remains very well supported by a weaker Yen. But another consolidation back to 31000 points is sorely needed to take some heat out:
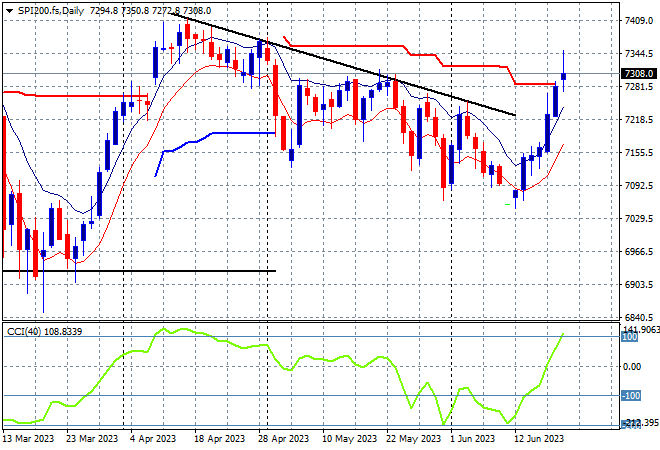
Australian stocks were the odd ones out again with the ASX200 lifting nearly 0.9% to close at 7357 points.
SPI futures however are down more than 0.4% as it follows Wall Street again. I’ve long contended that with an entrenched downtrend since the April highs its looking like a tough road ahead. Daily momentum has been able to get out of the oversold zone as price action bounces off its new monthly low as recession jitters mounted with ATR resistance at 7300 points proper the next level to beat:
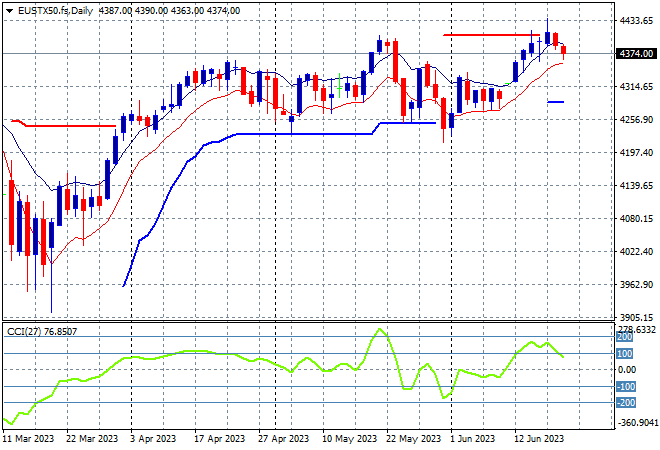
European markets are still struggling to find confidence once again post the ECB hike with more losses across the continent that saw the Eurostoxx 50 Index finish 0.4% lower at 4343 points.
The daily chart was previously showing a clear breakout that turned into a bull trap but support at the 4200 point level has so far been well defended. Weekly resistance at the 4350 points level is the true area to beat next with price action indicating this breakout is losing steam however, so watch for a close below the low moving average next:
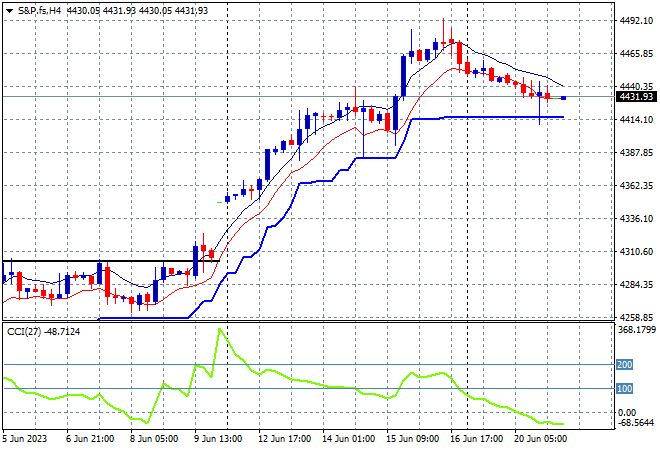
Wall Street reopened after the long weekend with the headline Dow off more than 0.7% while the NASDAQ put in a minor loss and the S&P500 went the mid road, falling 0.4% to finish at 4388 points.
The four hourly chart shows how support has been very strong above the 4200 point level with the post NFP bounce pushing straight through the 4300 point area which had been medium term resistance (upper black line). This clears the previous lack of conviction to confirm a new uptrend, but the crack through the 4400 point level has lost steam as price action shows a deflation back to ATR support at the 4400 point area:
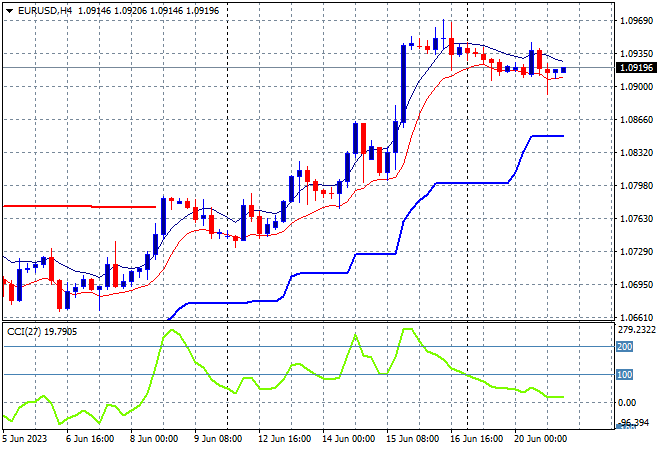
Currency markets were again fairly calm compared to equities with the USD holding ground against most of the majors although Euro is still looking firm here just above the 1.09 handle.
Short term price action had been building quite positive before last week’s ECB meeting, having bounced off the mid 1.07 level that was resistance with short term momentum now retracing from overbought conditions. The union currency had been on a longer term downtrend but the April highs above the 1.10 handle are now in sight if it can hold here at the 1.09 level:
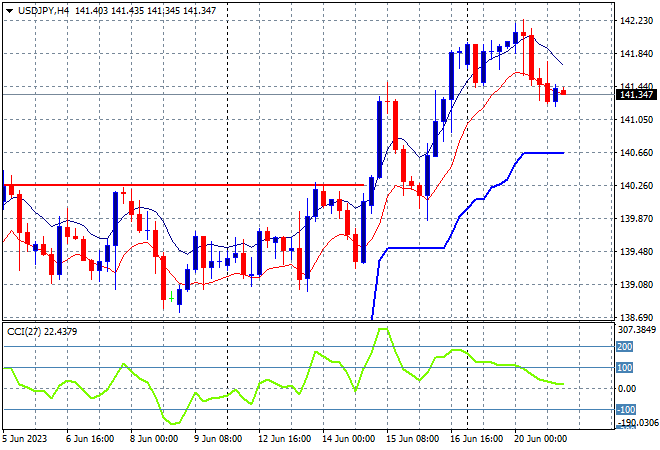
The USDJPY pair was unable to push higher overnight with the breach of the 142 level only temporary as a small retracement sent it back to the mid 141 level this morning.
The previous consolidation back down to trailing ATR support was looking like repeating itself here, turning into a medium term consolidation but the BOJ pause is giving the pair new life. Four hourly momentum is definitely back into overbought mode but short term price action looks way overdone:
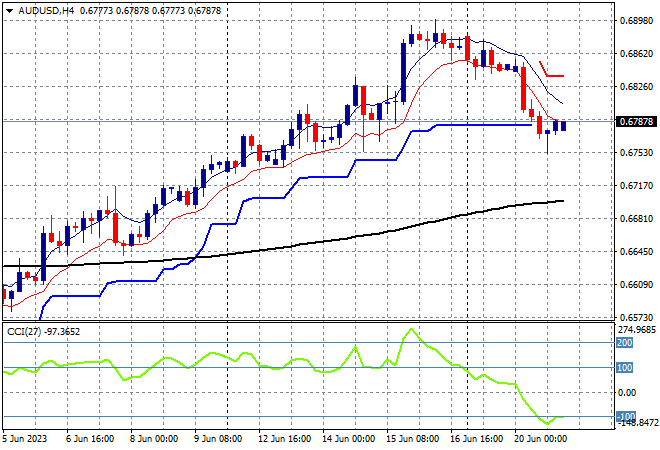
The Australian dollar rolled over yesterday on release of the RBA minutes and has stayed below the 68 handle as of this morning with ATR support now taken out in the short term.
The Pacific Peso was looking to put previous overhead resistance at 67 cents but price action has now provided a pullbacck down to the 68 cent level to take some steam out short term. It needs to hold at this level before re-engaging:
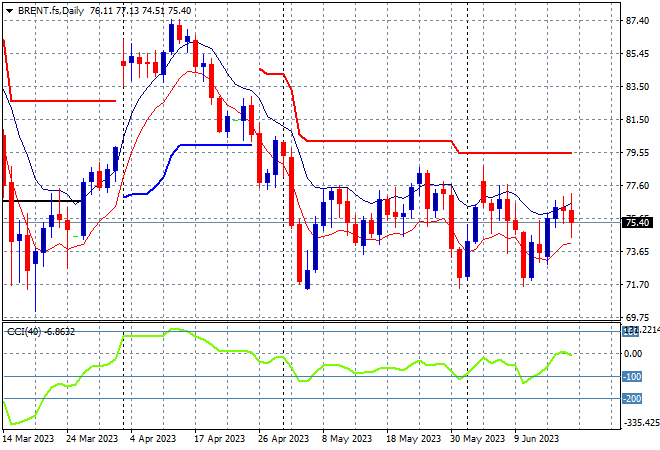
Oil markets were down across the board due to a slightly stronger USD with Brent crude finishing at the $75USD per barrel level.
This keeps price contained around the December levels (lower black horizontal line) and the March lows with daily momentum now finally getting out of oversold mode but still negative. A proper reversal will require a substantive close above the high moving average here on the daily chart before threatening a return to $70 or lower:
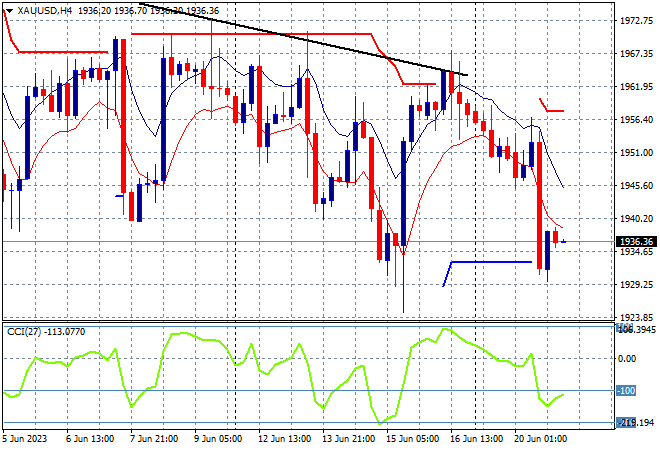
Gold suffered again out of the undollars overnight with a deflation back below the $1930USD per ounce level as it continues its slow melt down, finishing at the $1936 level this morning..
The four hourly chart had been showing this whipsaw movement in recent weeks but with a continued failure to get back above the psychological $2000USD per ounce level still holding it back, with short term ATR resistance the level to beat here. I’m still watching for signs of capitulation below $1930:
Glossary of Acronyms and Technical Analysis Terms:
ATR: Average True Range – measures the degree of price volatility averaged over a time period
ATR Support/Resistance: a ratcheting mechanism that follows price below/above a trend, that if breached shows above average volatility
CCI: Commodity Channel Index: a momentum reading that calculates current price away from the statistical mean or “typical” price to indicate overbought (far above the mean) or oversold (far below the mean)
Low/High Moving Average: rolling mean of prices in this case, the low and high for the day/hour which creates a band around the actual price movement
FOMC: Federal Open Market Committee, monthly meeting of Federal Reserve regarding monetary policy (setting interest rates)
DOE: US Department of Energy
Uncle Point: or stop loss point, a level at which you’ve clearly been wrong on your position, so cry uncle and get out!wrong on your position, so cry uncle and get out!