
The excellent Stephen Blitz at TSLombard. My only point to add is that I think it will be a moderate not modest recession.
In one of the more interesting turns in the annals of US business cycle history, the lifting of the debt ceiling may very well be what kicks the economy into recession – with disinflation dutifully following. Inflation is financed, and in this brief period from the onset of Covid to today, the financing began with massive Treasury transfers monetized by the Fed, followed on by an expansion of bank lending fuelled by QE’s unique form of monetary expansion.
Right now, growth is slowing. The price of goods-related activity is dropping but inflation in services (and margins) remain stubbornly high.
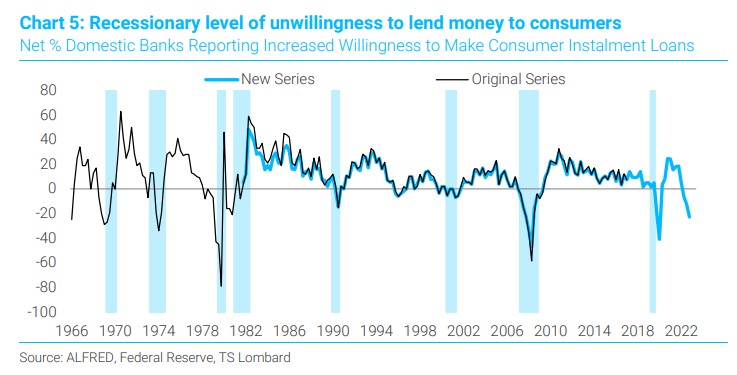
It will take a recession to reverse course and recessions always begin with curtailed credit. The SLOOS responses are recessionary without a doubt (see Chart 5), and bank lending is falling off sharply – with cash heading back to the Fed (no surprise).
Everything is in line to grind growth lower (we will see about retail sales today), and the anticipated surge of issuance following debt ceiling lift off will at last put bite into QT – mitigated to an extent by the falloff in the demand for loanable funds.
I still hold the view that real GDP drops about 1% Q/Q SAAR in Q2 and 1.5% in Q3, with unemployment rising to 5.5% and the funds rate dropping to 3% (sooner than most think) in response to higher unemployment.
The worse outcome is no recession at all – it will rhyme with the 1966-67 credit crunch that skirted recession but, in doing so, skewed monetary policy and the 15-year “Great Inflation” was the result.
In the meantime, ignore the “Fedspeak”. Earnest as it might be, the FOMC, like the markets, their plans are beholden to incoming data, and they have no better idea of what’s coming next than anyone else. As they have proven time and again.
The cooling among the forces pushing CPI is evident in my dashboard (see table below).
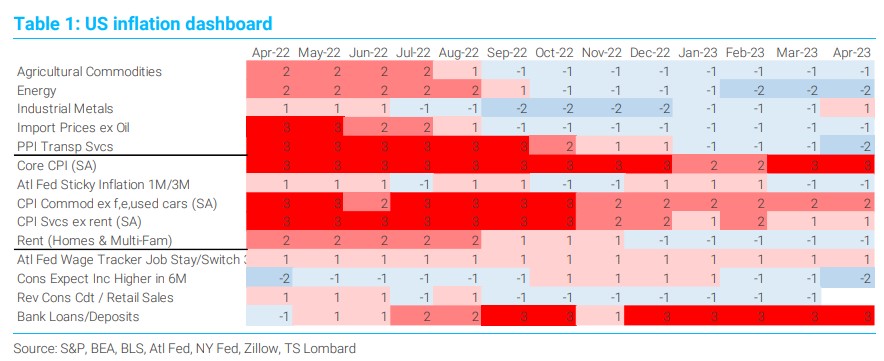
Shifting to PPI, we see the pull down in prices from goods activity but stubborn service inflation.
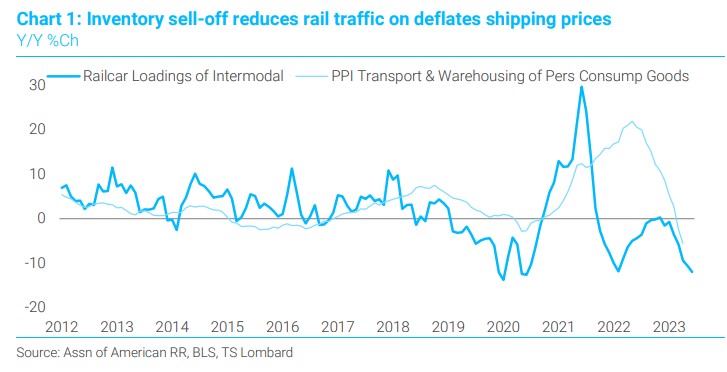
PPI includes prices not paid directly by consumers as opposed to CPI, therefore the trade services index measures changes in margins received by wholesalers and retailers.
Consumer inventories are being worked down as evidenced by the sharp Y/Y decline i intermodal (shipping containers mostly) riding the rails (Chart 1). In response, the PPI for transportation and warehousing of personal consumption goods is outright deflating.
Industrial production of business equipment, a higher frequency indicator of capex in GDP, peaked a year ago and continues to decline. The PPI for capital equipment for manufacturing is declining as well, on a year over year basis.
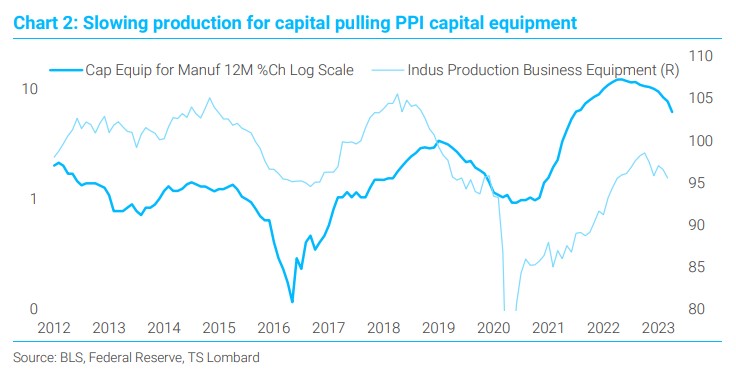
Industrial production of business equipment, a higher frequency indicator of capex in GDP, peaked a year ago and continues to decline. The PPI for capital equipment for manufacturing is declining as well, on a year over year basis.
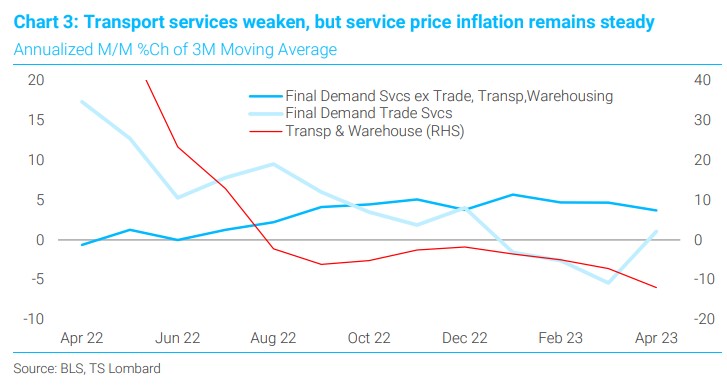
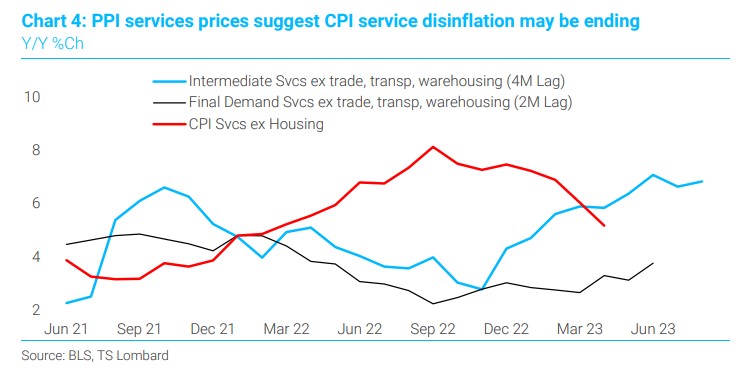
The link from PPI to CPI is not strong, but is stronger for services. In the 2012-19 period, intermediate service prices ex trade, transport and warehousing led final services prices by around 4 months, PPI final services led CPI services by around 2 months. I am using Y/Y % because of the wide M/M swings in intermediate service prices.
Those swings, more critically, makes PPI a better indicator of when softening demand is weakening prices – or the opposite.
Non-residential real estate rents rose 2.4% M/M after falling 1.6% in March and -4.2% in February.
Residential property fees were up 0.3% after falling in four of the prior five months.
One month does make a trend, but with everyone looking, waiting, and expecting for falling rents to pull down housing inflation, perhaps the expectation is overdone.
Looking at Chart 4, the PPI service indicators (final and intermediate) imply that, barring recession, CPI service price disinflation may be coming to an end.
From inflation to signs that credit is about to squeeze the economy.
The survey of Senior Loan Officers is instructive in terms of the sharply higher unwillingness to extend credit and a seemingly similar drop in sentiment when it comes to borrowing.
Chart 5 illustrates the net percentage of banks willing to make consumer instalment loans going back to 1966. This is longest series the Fed has, the reason I am using it, and it is quite clear that this negative level only comes with recession (Chart 5).
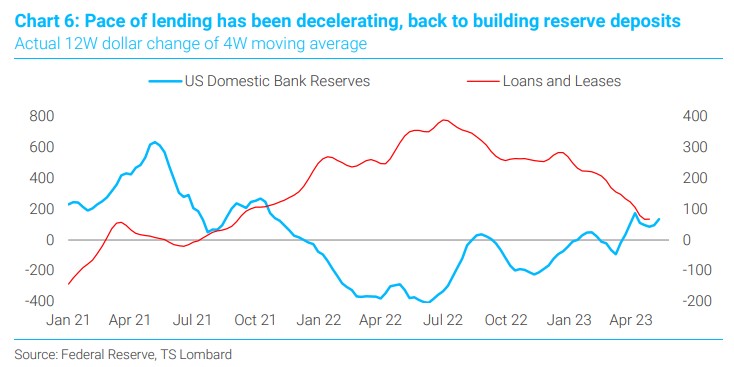
The slowdown in bank lending began before the current problems with small banks.
Lending began to slow in the middle of last year and is about to negative, basis is 12W dollar change in 4W moving average.
It is no surprise that with the decline in lending, up went reserves. Yes, total bank reserves dropped during that period, but it was foreign banks pulling funds.
The loan/reserve story is interesting, to be revisited when lending ramps up again.
Reduced extensions of bank credit always bend real growth lower.
It is true that non-banks are stepping their activities and, perhaps, will replace small banks as an intermediary of funding for Main St.
But to put this story line in perspective, small banks have $4.4 trillion in loans outstanding, aside from large banks and the GSEs the only sector that comes close in lending is “rest of world”, at 25% of the small bank total.
Nonbank financial institutions are growing, but for this cycle at least, their credit extensions are unlikely to prevent less bank credit from creating more unemployment.
In sum, recessionary forces continue to build, and an amped return of Treasury borrowing is likely to put the final squeeze on credit and push the economy into recession.
There is no getting back to 2% without tamer service inflation, and the present run of numbers suggests a reacceleration is possible.
No recession will prove to be a worse outcome. The Fed is on hold, and by mid-June the data are likely to support the decision.
The FOMC denies they will cut, but they also said inflation was transitory and were not going raise the funds rate for years.
