
The release of the latest FOMC minutes and continued US debt ceiling negotiations kept risk markets in selling territory overnight on both sides of the Atlantic again. Currency markets fled to the safety of USD with Euro smacked below its previous weekly low while the Australian dollar collapsed under the weight of the Federal Reserve’s intentions, heading straight to the 65 cent level.
Meanwhile US Treasury yields were largely unchanged with the 10 year remaining above the 3.7% level while oil prices continued their recent breakout with Brent crude lifting through the $78USD per barrel level. Gold followed the lead of the other undollars and was sold off swiftly to the $1950USD per ounce level.
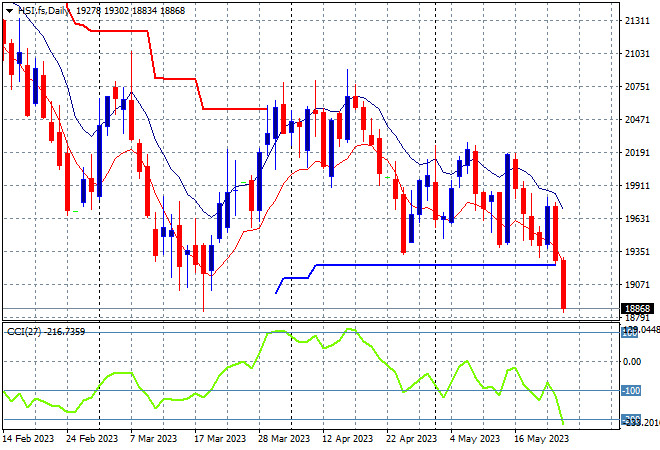
Looking at share markets in Asia from yesterday’s session where mainland Chinese share markets sold off sharply with the Shanghai Composite down over 1.2% to 3204 points while the Hang Seng followed suit, breaking down and finishing more than 1.6% lower to almost threaten the 19000 point level, closing at 19115 points.
The daily chart has been showing resistance building above at the 20500 point level as price action wants to return to the start of year correction phase below 19000 points with a failure to make any new weekly highs since early April. This looks poised for another breakdown at the 19000 point level if it can’t clear those levels soon – watch trailing ATR support to come under pressure next:
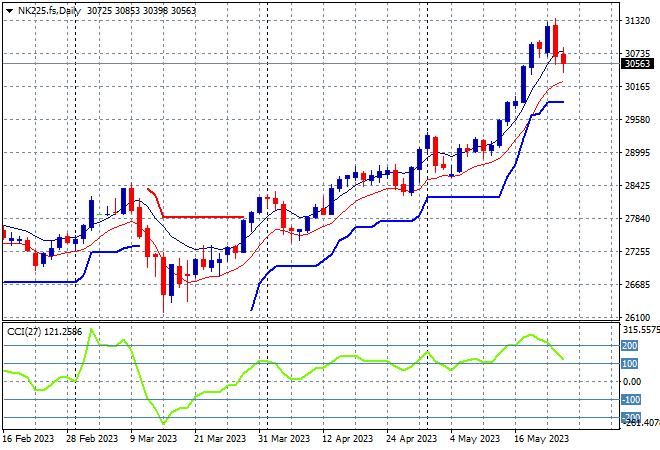
Japanese stock markets also joined in on the selling fun with the Nikkei 225 closing 0.8% lower at 30682 points. Futures are indicating a further small selloff on the open however that could push below the 30,000 point level.
This trend had been unsustainable with price action nowhere near the low moving average area for several sessions, indicating that overall risk sentiment was very one sided and could result in a violent pullback. Trailing ATR support kept ratcheting higher as the 30000 point level is breached with daily momentum now reverting from extremely overbought mode but so far this pullback has been quite mild:
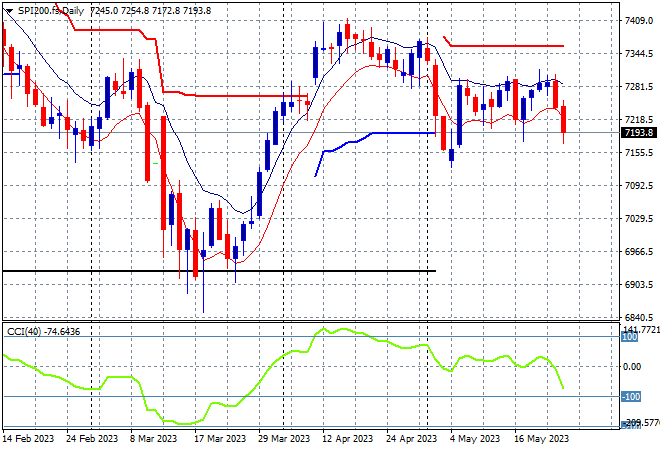
Australian stocks were again the best performers relatively speaking with the ASX200 closing 0.6% lower at 7203 points.
SPI futures are down at least 0.4% on the turmoil on Wall Street overnight. Daily momentum is now firmly in the negative zone as price action breaks to the downside.
The upside target in the medium term was the April highs at 7400 points but this looks unattainable as price action has been unable to break above the high moving average band with movement towards support instead at the 7100 point area the next phase:
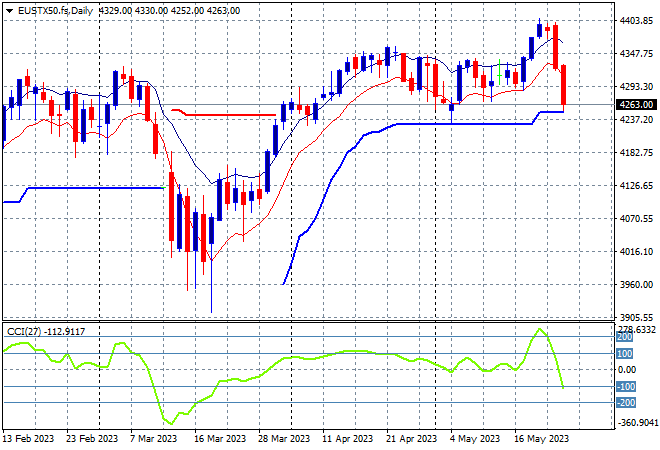
European markets were in strong selling territory all session with broad losses across the continent with the Eurostoxx 50 Index closing 1.8% lower to pull back below the 4300 point level at 4262 points.
The daily chart was showing a clear breakout here after price action was caught between strong trailing ATR support at the 4200 point level and weekly resistance at the 4350 points level, but the previous bearish engulfing candle more than suggested a bull trap. I warned that any hiccups in the risk complex could see a strong pullback to the 4300 point level or lower with all eyes on ATR support at the 4200 point area:
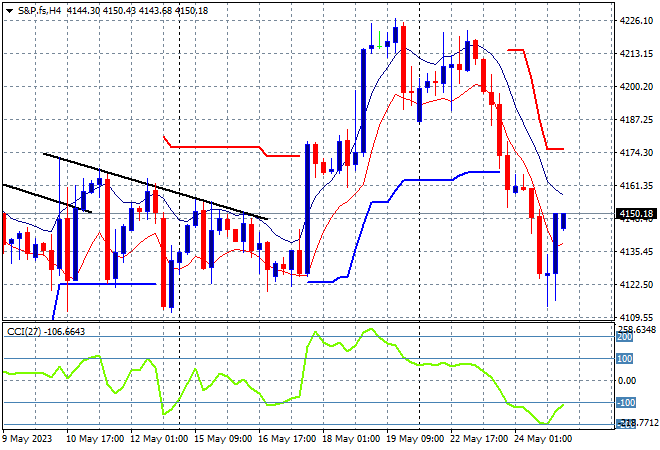
Wall Street sold off across the board with the tech heavy NASDAQ losing more than 0.7% while the S&P500 also eventually lost nearly 0.8% to remain below the 4200 barrier level yet again, finishing at 4115 points.
The four hourly chart shows the falls could have been greater with a late bounce in the session following a potential reprieve in the debt ceiling impasse, but for now it remains tenuous. The failure to push through resistance has kept the market in check with a series of lower highs showing a lack of conviction while the debt ceiling negotiations drag on – this could get ugly:
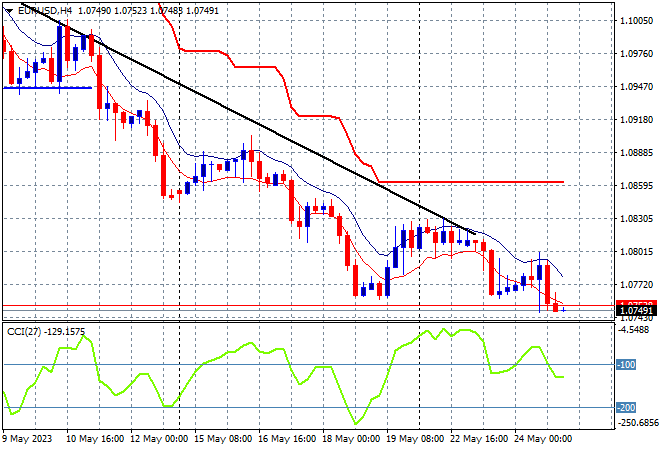
Currency markets remain set on their dominant USD trend as the impasse on the US debt ceiling and the release of the FOMC minutes solidified that notion. Euro was again pushed well below the 1.08 handle to make a new weekly low with the daily trend never under threat.
Short term momentum on the four hourly chart shows a continuation of oversold settings as resistance has properly shifted to former support at the 1.09 level with more downside potential building:
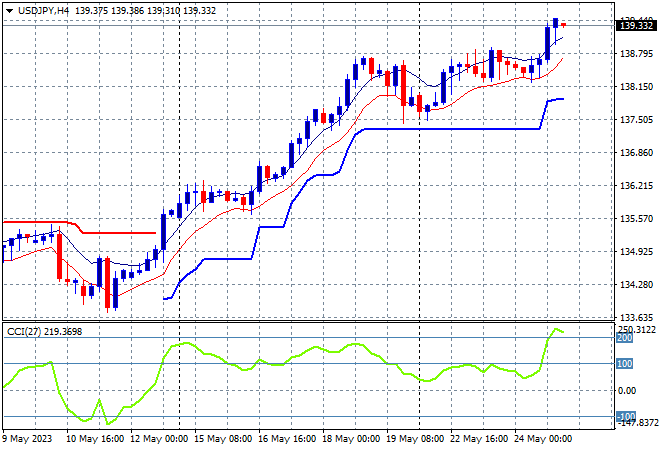
The USDJPY pair however saw an uplift as safe haven buying in Yen evaporated with a minor change in correlation with Japanese stocks with the 139 level breached overnight.
This breakout had been getting quite unsustainable as price action moved further away from its own high moving average and short term momentum became nearly extremely overbought. A consolidation back down to trailing ATR support is over before it even started with price action now above those overbought highs and likely to extend further:
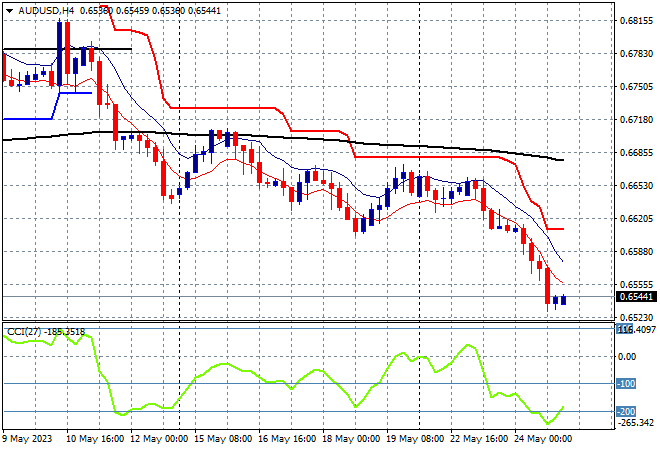
The Australian dollar in contrast remains totally depressed here, breaking down well below the 66 cent level against USD to make a new monthly low at the mid 65 cent level.
Last week’s higher than expected unemployment print plus continued strong comments from the FOMC minutes can’t help the Pacific Peso, which continues to reject previous overhead resistance at 67 cents as this move could extend well below the 66 cent level:
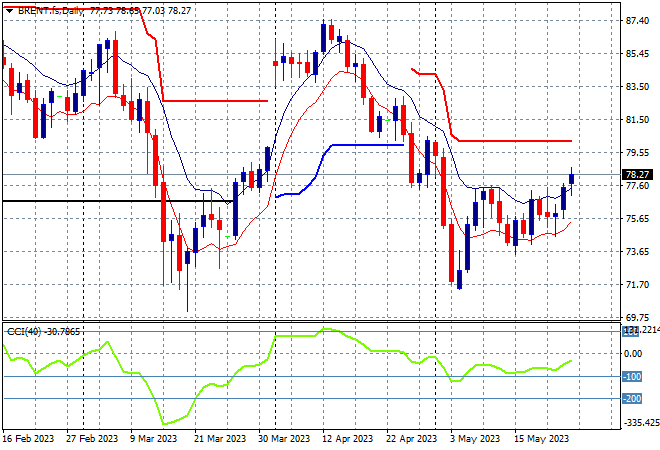
Oil markets are trying to get out of their sideways funk with Brent crude moving up through the $78USD per barrel level overnight, making another new daily high that could be a breakout move.
This pushes price back above the December levels (lower black horizontal line) after breaching trailing ATR support previously with daily momentum getting out of oversold mode. A proper reversal will require a substantive close above the high moving average here on the daily chart before threatening a return to $70 or lower:
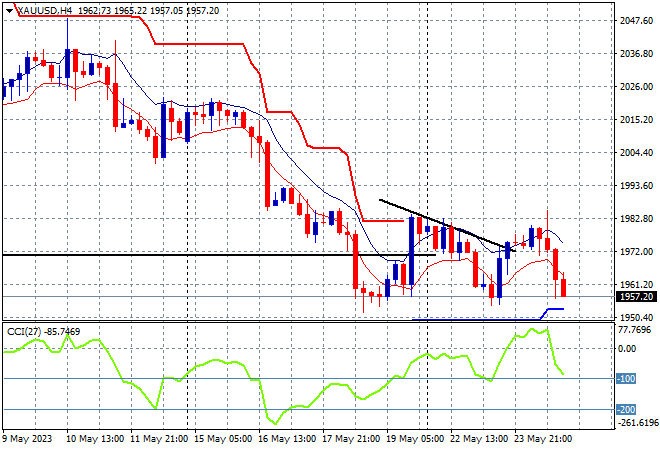
Gold is still in a major decline phase after failing to recover from its pullback following the US unemployment print with its breakdown below the psychological $2000USD per ounce level. Last night saw a return of price action to the previous weekly lows to finish at the $1957 level.
The keeps price action contained around previous weekly support levels at the $1980 level (lower black horizontal line) with short term momentum returning to the negative zone. The medium term direction however is not in gold’s favour:
Glossary of Acronyms and Technical Analysis Terms:
ATR: Average True Range – measures the degree of price volatility averaged over a time period
ATR Support/Resistance: a ratcheting mechanism that follows price below/above a trend, that if breached shows above average volatility
CCI: Commodity Channel Index: a momentum reading that calculates current price away from the statistical mean or “typical” price to indicate overbought (far above the mean) or oversold (far below the mean)
Low/High Moving Average: rolling mean of prices in this case, the low and high for the day/hour which creates a band around the actual price movement
FOMC: Federal Open Market Committee, monthly meeting of Federal Reserve regarding monetary policy (setting interest rates)
DOE: US Department of Energy
Uncle Point: or stop loss point, a level at which you’ve clearly been wrong on your position, so cry uncle and get out!wrong on your position, so cry uncle and get out!