
BofA with the note. More credit-crunchy evidence.
Key takeaways
• After a strong start to the year, Bank of America credit and debit card spending per household moderated further in March, to 0.1% year-over-year (YoY), the slowest pace since February 2021. Sequentially, card spending per household fell 1.5% month-over-month (MoM), seasonally adjusted.
• In our view, slowing wages, a drag from lower tax refunds, and the expiration of Supplemental Nutrition Assistance Program (SNAP) emergency allotments are driving the slowdown. Bank of America data shows after-tax wage and salaries growth slowed to just 2% YoY, down from the peak of 8% in April 2022. Meanwhile cumulative tax refunds are tracking around 10% lower than last year.
• How concerned should we be about spending going forward? The good news is that consumers still have financial buffers as suggested by lower credit card utilization rates compared to 2019. However, signs of a cooling labor market and a sustained deceleration in wages could tilt the risks to the downside.
A soft month for card spending
After starting the year on a strong footing, Bank of America aggregated credit and debit card spending per household moderated in March to 0.1% YoY growth, the slowest pace since February 2021 (Exhibit 1). On a seasonally adjusted (SA) basis, card spending per household contracted by 1.5% month-over-month (MoM), although the three-month annualized growth was 0.9%.
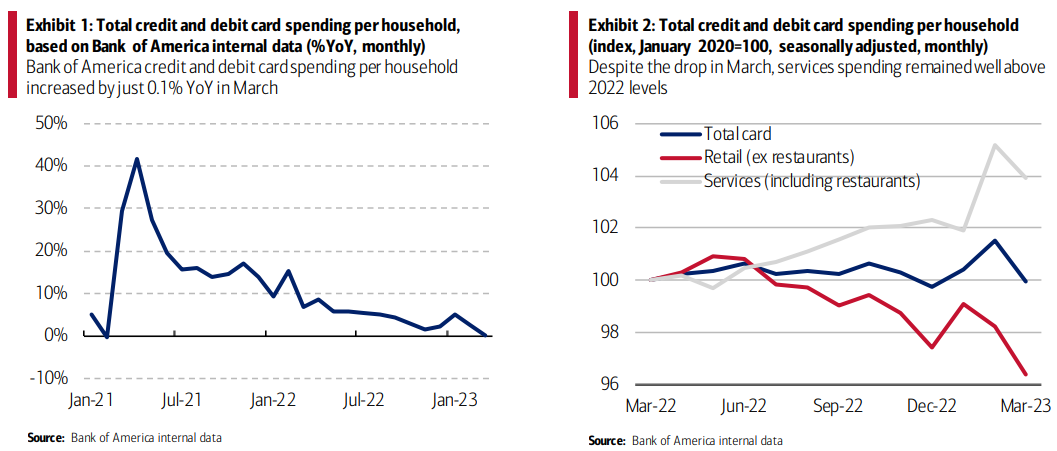
It is important to note that Bank of America credit and debit card spend comprises just over 20% of total consumer payments data. Broader consumer payments continue to grow more strongly. Total payments growth across all channels (Automated Clearing House (ACH), Bill Pay, Credit and Debit Card, Wires, Person-to-Person, Cash and Check) increased 9% YoY. Specifically, ACH services payments, which include rent, utilities and childcare, were up 10% YoY. The caveat is that some consumer payments tend to go towards necessities and increases are more likely to be driven by rising prices and interest rates, with debt payments such as credit card repayments, mortgages and auto payments, up 13% YoY, for example.
Reasons for a weak March: slowing wages and fiscal headwind
How worried should we be about weaker spending in March? In our view, the main two reasons for the slowdown in card spending per household are:
1) slowing wage growth, and
2) the net drag from fiscal impacts including lower tax refunds and expiration of SNAP emergency allotments.
Lower wage growth as labor markets soften
Extraordinary wage growth was one of the main drivers behind the resiliency in consumer spending in 2022, allowing consumers to keep spending even in the face of higher inflation. However, the latest Bank of America internal data suggests the boost from wages might be fading.
In March 2023, the growth in after-tax wages and salaries, based on Bank of America aggregated consumer deposit data, slowed to just 2% YoY on a three-month moving average basis, down from the peak of 8% in April 2022, and representing the lowest rate since June 2020. A decline was also seen in the Bureau of Labor Statistics (BLS) payroll report, which shows that average hourly earnings moderated to 4.2% YoY in March from the peak of 5.9% in March 2022.
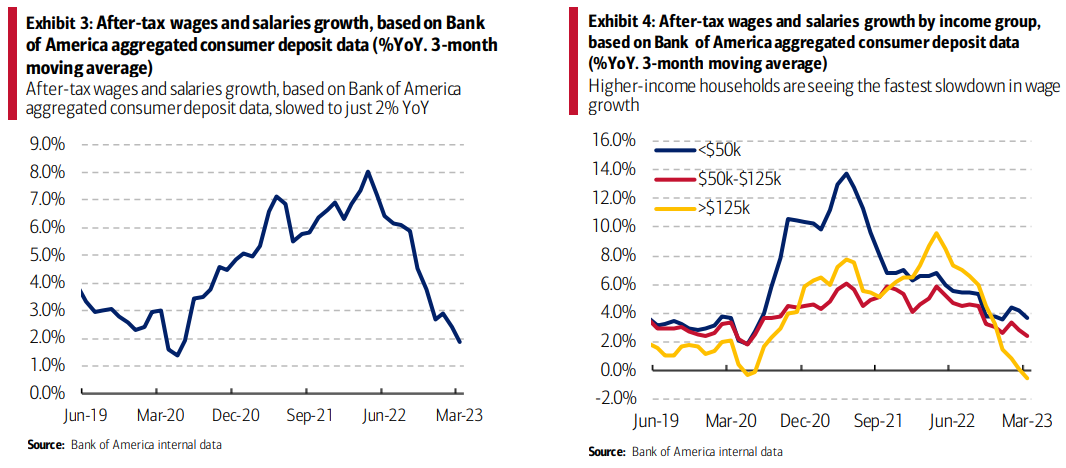
The sharper slowdown in wage growth in Bank of America data could be partly attributed to sample differences: Bank of America data likely captures a bigger share of higher-wage earners than the BLS jobs report and it is the higher-income households that are seeing the fastest slowdown in wage growth (Exhibit 4). Where people are paid by the hour, Bank of America data also captures the impact of falling average hours on total pay packets.
It is worth noting that, according to Bank of America internal data, higher-income households saw wages contracting by 0.5% YoY in March 2023, the first negative growth reading since May 2020. In our view, this could be due in part to hiring freezes or job cuts in industries such as tech and financial services, which are putting downward pressure on wages in these sectors.
Lower tax refunds and SNAP expiration further headwinds
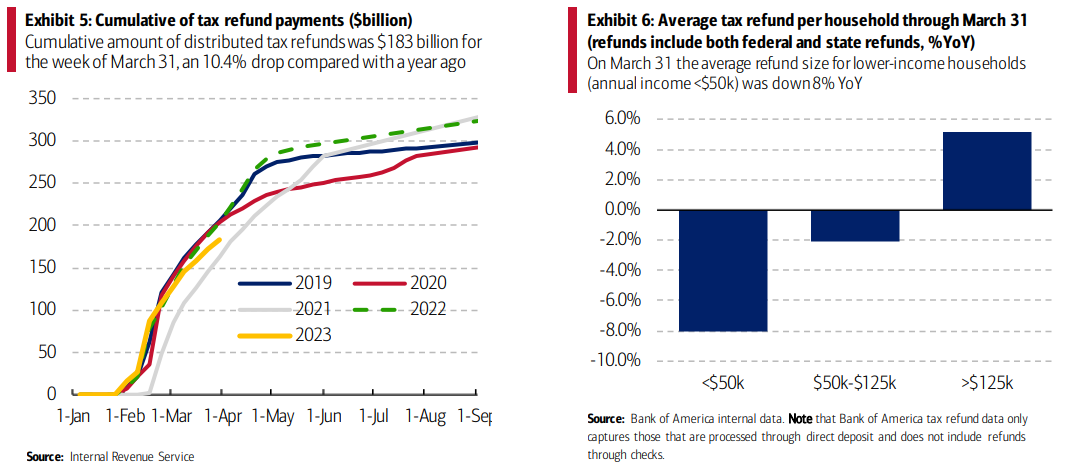
Besides moderating wage growth, lower tax refunds this year might be a mild drag on consumer spending. According to weekly data from the Internal Revenue Service (IRS), the cumulative amount of distributed tax refunds amounted to $183 billion for the week of March 31, a 10.4% drop compared with a year ago (Exhibit 5). Meanwhile, the IRS reported that the number of refunds processed was 3% higher than the same period last year, suggesting lower average refund sizes.
Why are tax refund sizes smaller this year? We see two main reasons for this. First, last year many people received the third stimulus payment of $1,400 through a tax refund, which increased the average refund size. Second, the enhanced Child Tax Credits expired in 2022, so families with two children under 6 years old won’t receive the extra $3,200 worth of tax credit.
Since the IRS data only provides an aggregated account, we’ve looked at Bank of America data to determine the group of consumers with the biggest drop in tax refunds. Our data shows lower-income households experiencing the biggest drop. As Exhibit 6 shows, on March 31 the average refund size for lower-income households (annual income <$50k) was down 8% YoY, the largest decline across income groups.
For middle-income households ($50k-$125k), the average refund size was also down but to a smaller degree of -2% YoY. In contrast, for the higher-income group (>$125k), the average refund was 5% bigger than a year ago. In our view, this could be due to realized losses in capital markets for higher-income households.
Another headwind for lower-income households could be the expiration of increased benefits under the SNAP in most states at the end of February. Over the pandemic, the United States Department of Agriculture (USDA) permitted states to provide increased SNAP benefits, or “emergency allotments” (EAs) through February 2023. These emergency allotments ensured a minimum SNAP benefit rise of $95 per household per month.
Some states stopped these extra payments before they were required to, but 32 states continued payments through the end of the authorization period. March was the first month when all SNAP benefits returned to “normal” amounts without the EA, although a few states are looking at ways to continue to provide enhanced support.
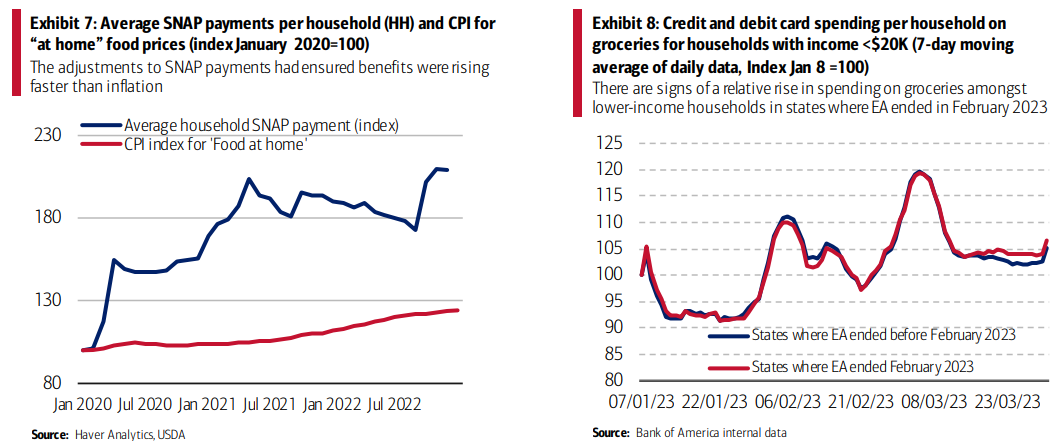
With expired EAs, households – especially those near the lower end of the income distribution – may come under additional strain, particularly given ongoing high food price inflation (Exhibit 8).
The latest Bank of America card data through March 31st suggests that lower-income households, particularly those with earnings below $20k per year, might have turned to their personal credit and debit cards for food purchases (Exhibit 8). As a result, the worry is that consumer spending in other discretionary areas could see a further squeeze. However, at this stage, Bank of America data only shows a limited aggregated impact. Nonetheless, with media stories highlighting a rise in food pantry use, many families may be struggling.
Exactly the same landing in Australia in 3,2,1…as Albo mass immigration lunacy crushes wages and the Lamington tax rebate goes “poof”.
