If suppliers are still telling you they are suffering from rising costs then find another one. Goldman with the update.
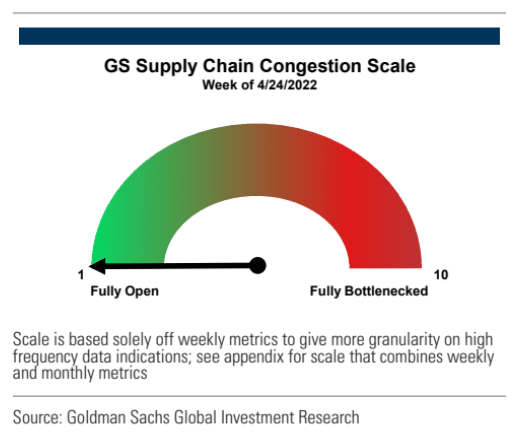
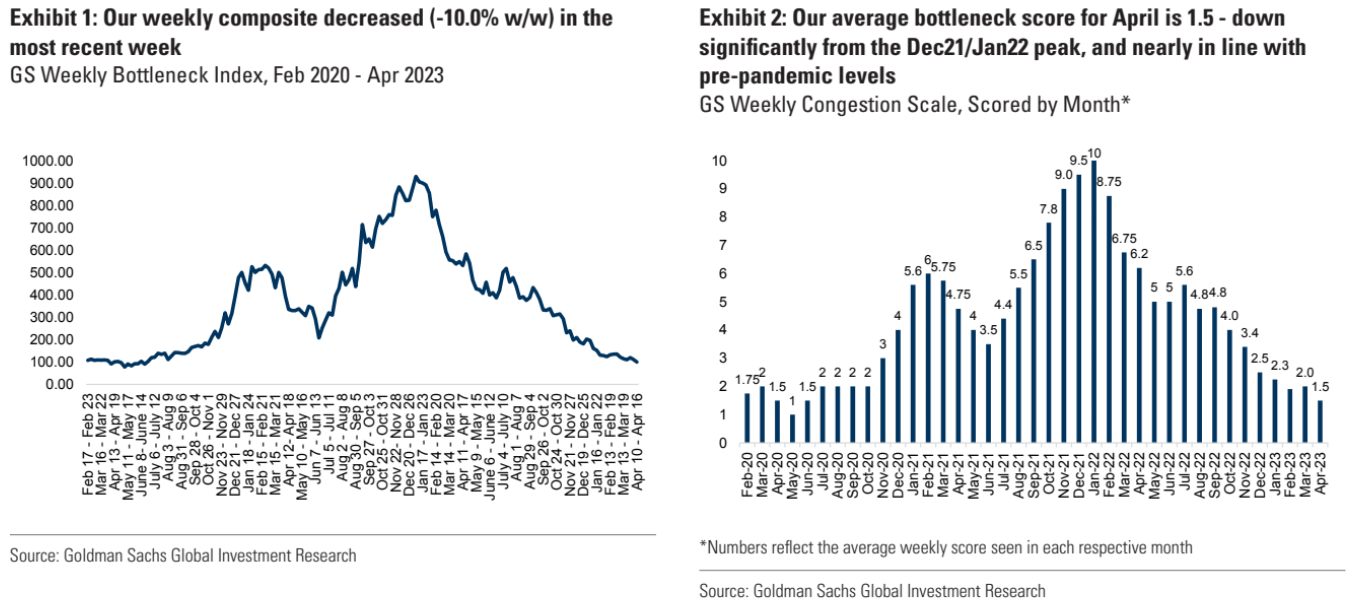
Our weekly bottleneck scale fell from ‘2’ to a ‘1’ this week, marking an official return to the pre-pandemic supply chain fluidity environment (as measured by our metrics in Exhibit 3) following three years of atypical congestion; this week, the absolute level of our congestion index ticked down ~10% w/w (Exhibit 1). The number of container ships waiting to dock and unload goods along the West Coast remained at zero for the 21st consecutive week while East Coast backlogs increased from 2 to 4; the effective ship backlog remains near zero, which\ compares to over 100 ships backlogged during peak congestion (Exhibit 6). West Coast intermodal rail performance improved compared to the prior week (dwell was lower for both UNP and BNSF; train speed increased), and overall intermodal traffic growth was less negative (albeit still negative overall in April; Exhibit 7). Chassis dwell time improvements were the largest drivers for this week’s downtick, with dwell declining ~30% w/w on average; furthermore, ocean container shipping rates (China to US West Coast) remained mostly unchanged at ~94% y/y (Exhibit 10). With finalized March data also now available, we updated our combined ‘weekly + monthly’ scale as well; March’s lagged, combined scale averaged a ‘1.6’, but the end-of-March score implied levels just 3% above ‘1’ territory — led mostly by improvements in container dwell times at the ports, including lower dwell for rail (Exhibit 13), in addition to more transportation labor (Exhibit 16) and warehouse capacity. Given today’s weekly leading index dropping to a ‘1’, and considering the end-of-March combined scaled score hovering just above ‘1’, we think we can exit April with a combined bottleneck scale implying supply chains in line with levels seen prior to March 2020.
The full text of this article is available to MacroBusiness subscribers
