CoreLogic’s daily dwelling values index hit another milestone over the weekend, with Sydney dwelling values falling 12% from their mid-February peak:
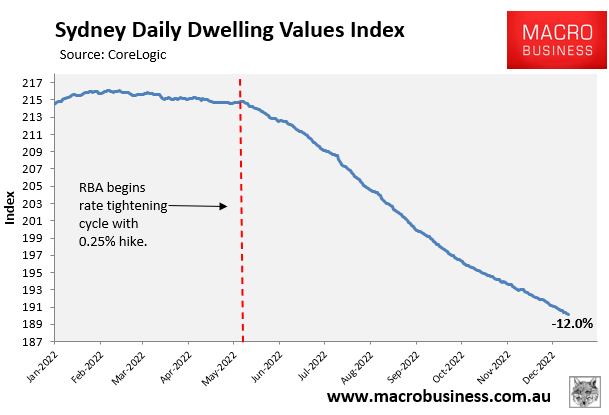
Virtually all of this decline has occurred following the Reserve Bank of Australia’s (RBA) first interest rate hike in early May.
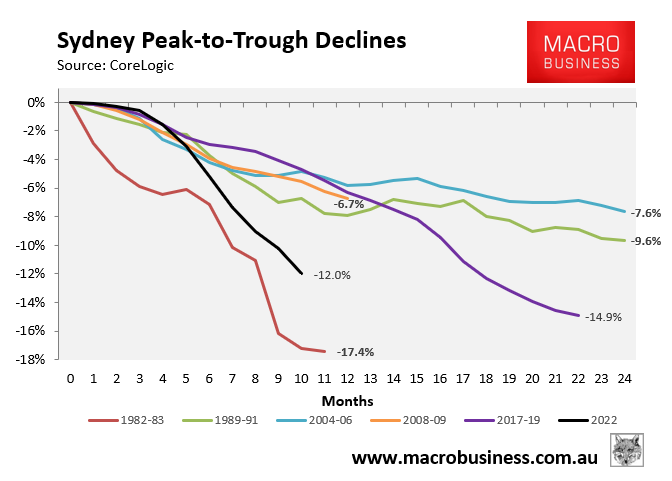
As shown in the next chart, which plots the current housing correction (in black) against prior episodes, the current 12% decline is the third largest and the second steepest in records dating back to 1980:
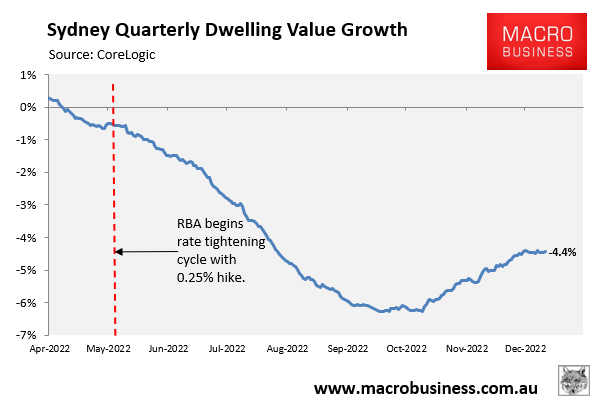
The ‘good’ news is that the quarterly pace of decline has eased to 4.4%, from a peak rate of 6.3% in September and October:
Nevertheless, at the current rate of decline, Sydney’s housing correction would exceed the record 1982-83 bust in around four months.
Given there is a good chance that the Reserve Bank of Australia (RBA) will hike the official cash rate (OCR) at least one more time, then the downward pressure on Sydney house prices will likely continue until at least mid-2023.
By that stage Sydney’s housing correction will be closing in on a 20% peak-to-trough decline.
Ultimately, how far Sydney house prices fall will depend on the actions of the RBA. But a record housing bust looks like an odds-on bet.
