
The latest housing finance data from the Australian Bureau of Statistics (ABS) showed that mortgage demand has collapsed, down 15.4% over the August quarter and 12.5% year-on-year.
As illustrated in the below charts, the ABS’ housing finance data has historically been a strong leading indicator for house prices, with new mortgage demand typically leading dwelling values by three months:
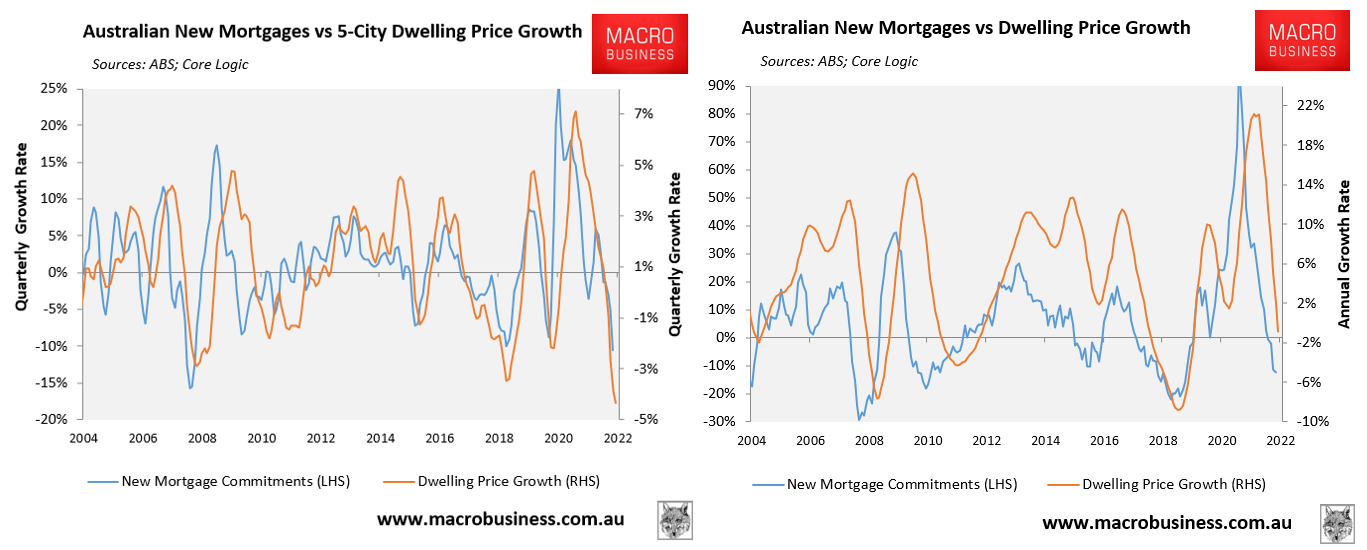
Mortgage collapse drags house prices down.
Australia’s housing correction is being driven by the three major capital city markets – i.e. Sydney, Melbourne and Brisbane.
The below charts plot the ABS’ mortgage growth against dwelling values across these markets.
Sydney:
Sydney dwelling values fell 6.1% over Q3 to be 9.0% below their January peak as at September:
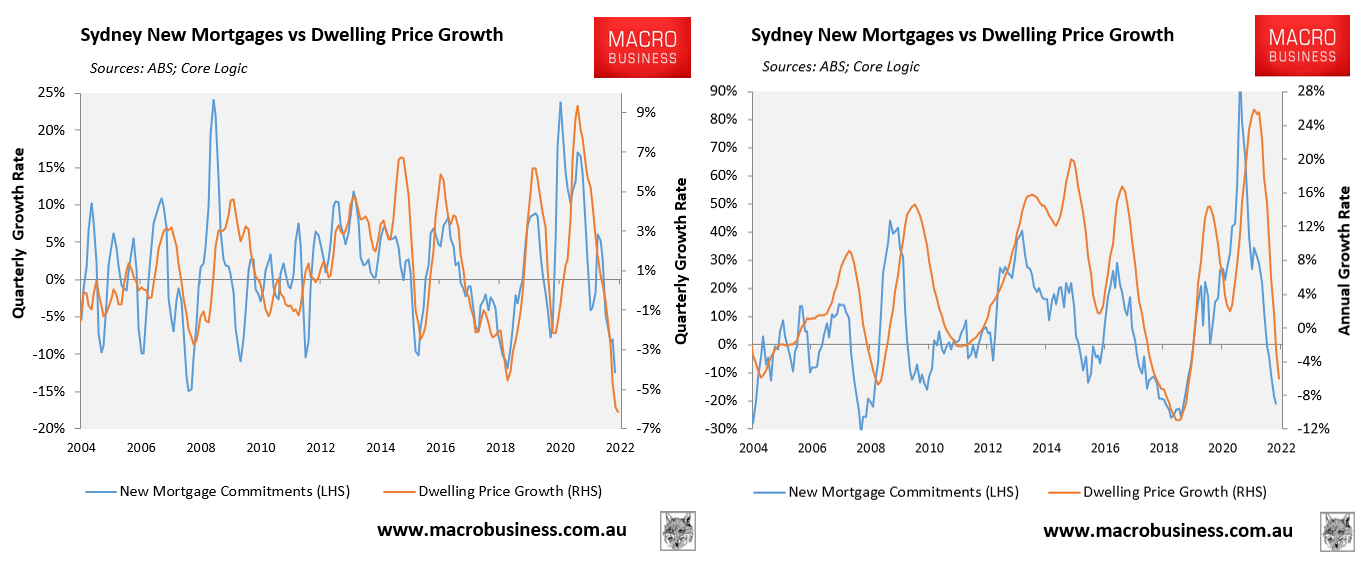
Sydney leads house price bust.
Melbourne:
Melbourne dwelling values fell 3.7% over Q3 to be down 5.6% from their January peak as at September:
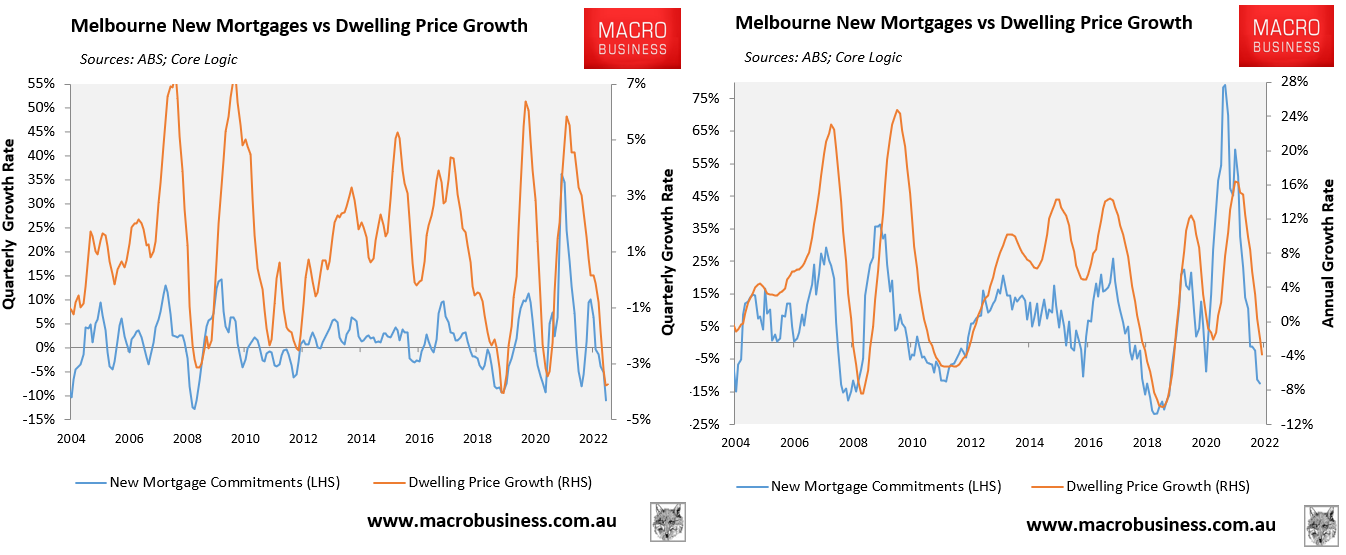
Melbourne experiencing second biggest price bust.
Brisbane:
Brisbane dwelling values fell 4.4% over Q3 to be down 4.4% from their June peak as at September:
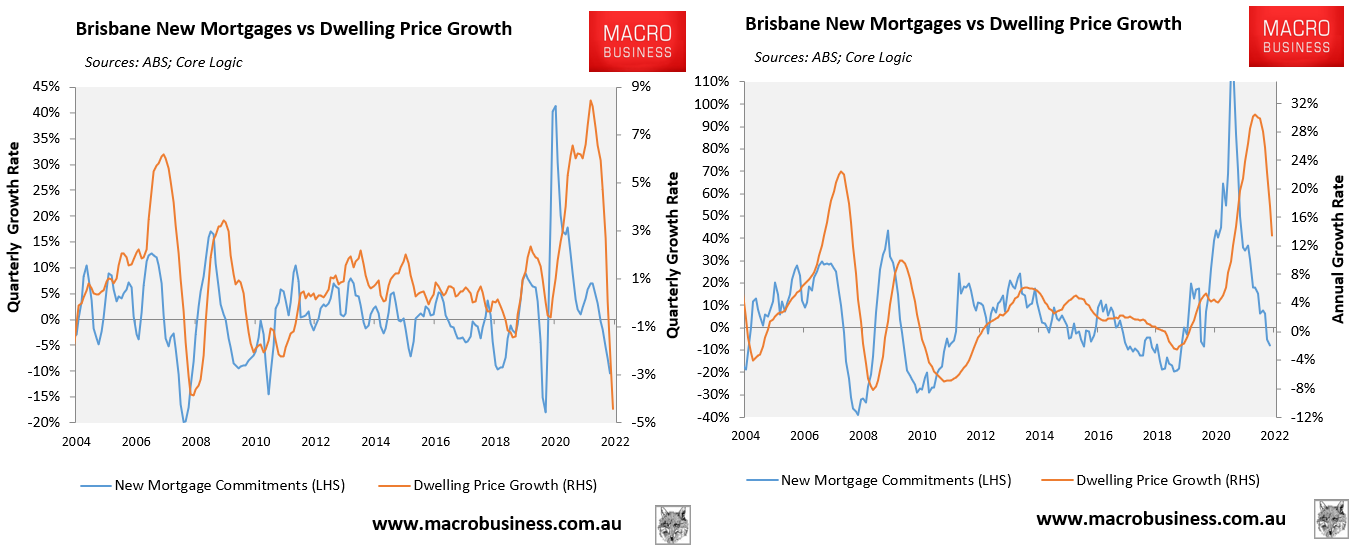
Brisbane late to the correction but falling fast.
The collapse in mortgage demand and ergo house prices makes sense given the Reserve Bank of Australia’s (RBA) aggressive monetary tightening has reduced borrow capacity by around 22%, according to PropTrack:
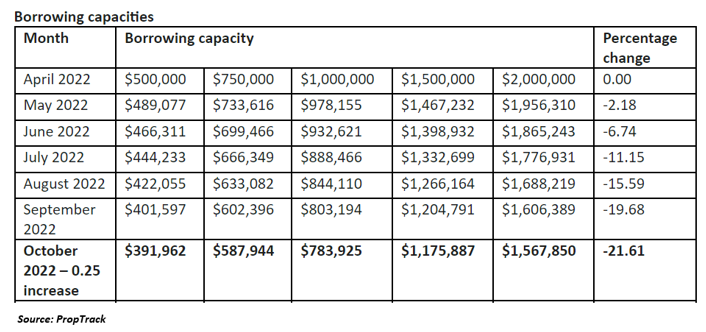
Sharp reduction in borrowing capacity.
Thus, if a household was permitted to borrow $500,000 in April before the RBA’s first rate hike, they will now only be permitted to borrow around $392,000.
Given the above ABS housing finance data is only updated to August, and there has been another 0.75% of tightening since then, it is safe to assume that mortgage demand has continued to fall, which will place further downward pressure on house prices.
