Michael Harnett at BofA with his latest. No arguments from me.
Heard on Street: “Investors close to the point where all they want is to be hugged.”
Tale of the Tape: we got a “bear hug”…SPX 5% in 5 hours after hot CPI because it was simply so oversold…2 out of3 Nasdaq stocks (3756 of them) this week traded >33%below their 52-week highs, almost 900 MSCI ACWI stocks had slumped >20% past 2months, 42 stocks within S&P500 trading below their COVID 2020 lows.
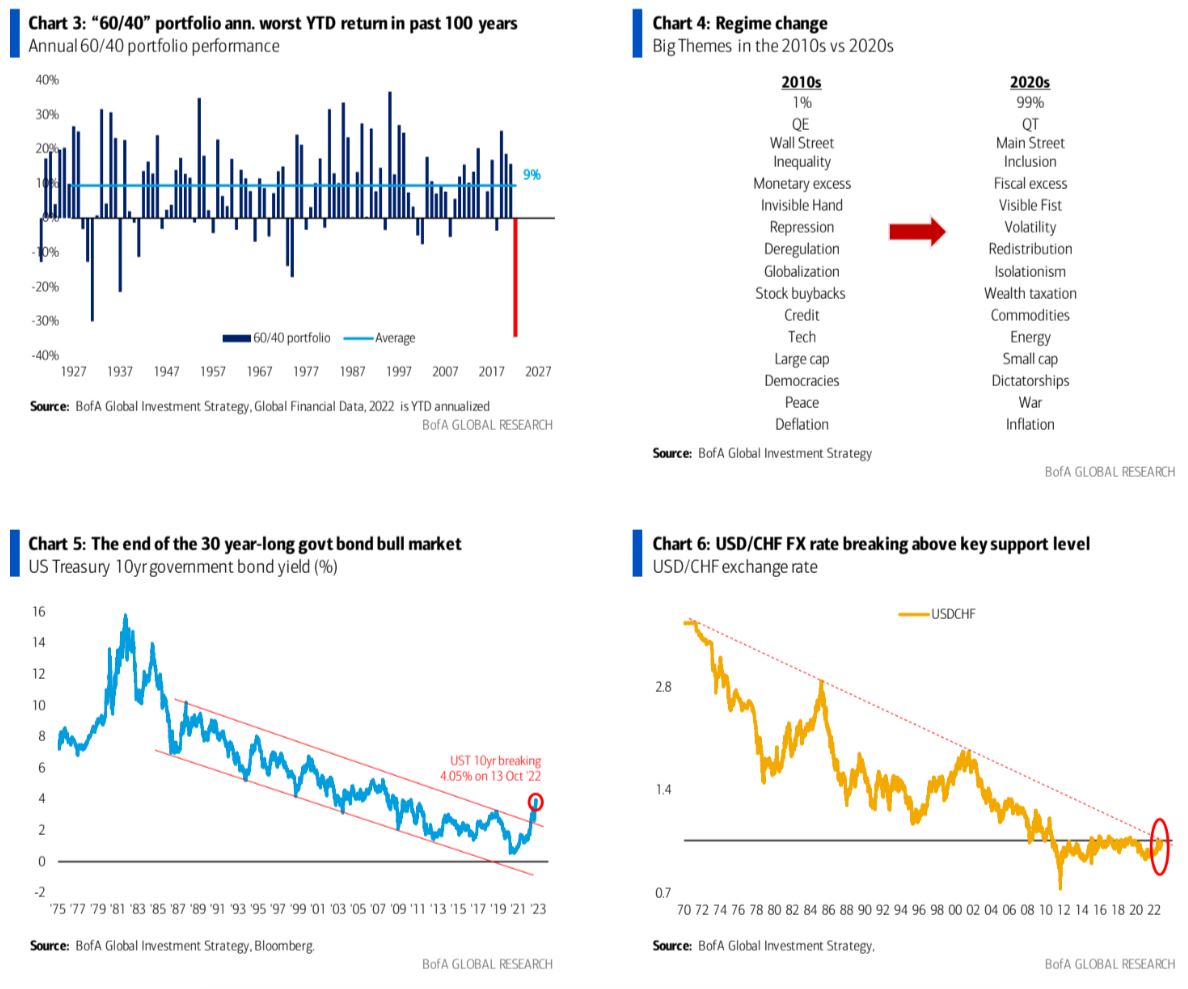
The Price is Right: why investors need a hug…2022 annualized return on “60/40” portfolio -34.4%, worst in past 100 years (Chart3); even for cash/commodity/stock/bond “25/25/25/25” defensive“ permanent portfolio” -11.9%, worst since 2008.
The Biggest Picture: outperformance of “25/25/25/25” vs “60/40” portfolio in’22 largest since 1973 (Chart2); but optimists note 1974 ended with “peak CPI” & “peak Fed”; a “60-40” portfolio returned 24% in ’75, 21% in ’76; we say most contrarian trades at the 2023 lows (this week was not ultimate low) = “long 60/40” & “short US$”.
Weekly Flows: $0.3bn to equities, $0.1bn to cash, $0.3bn from gold, $9.8bn from bonds.
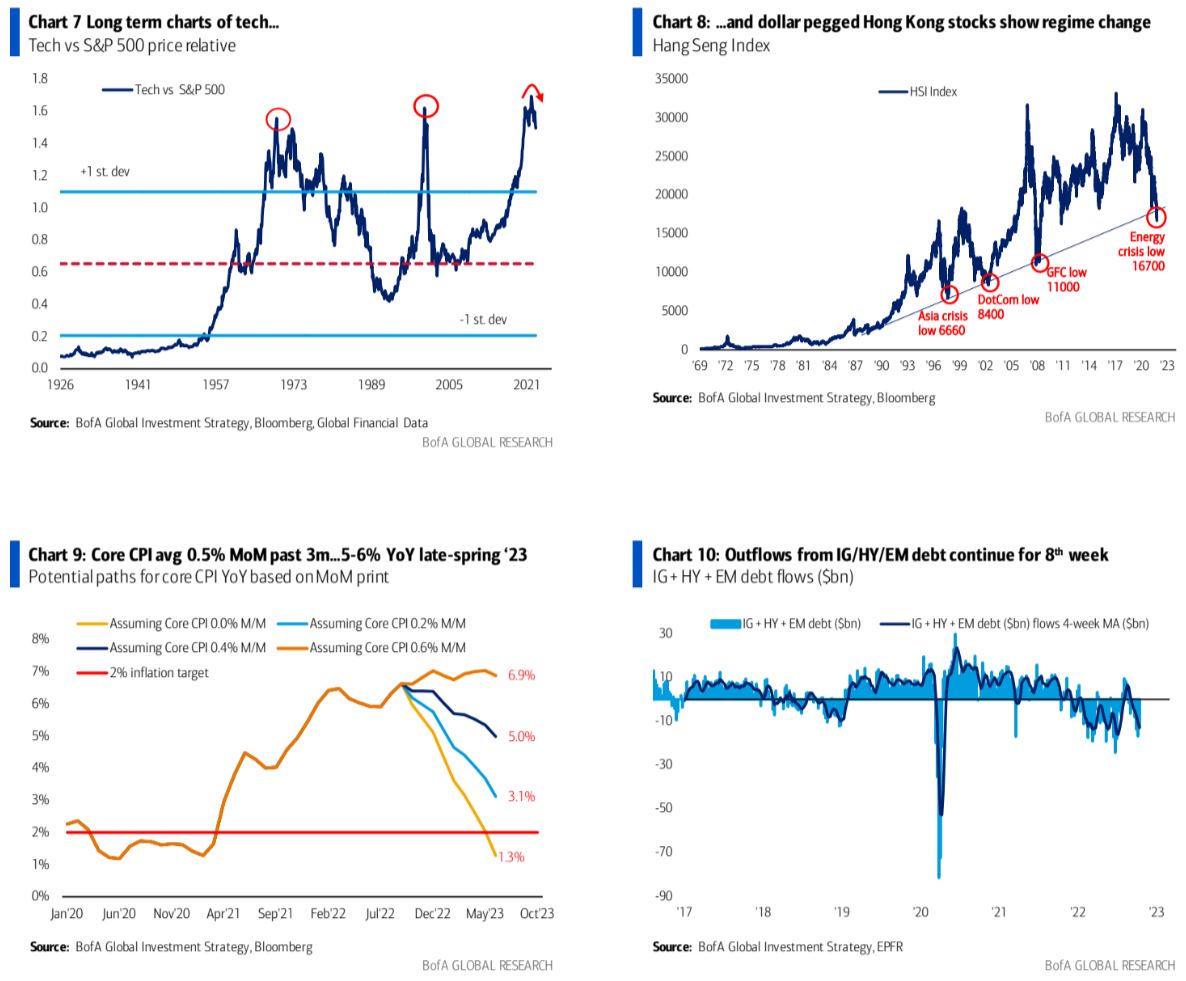
Flows to Know: outflows from IG/HY/EM debt continue for 8thweek (Chart 10); 6thweek of outflows from financials ($0.3bn); 1st outflow from infrastructure in 11 weeks ($0.1bn); 18th week of outflows from bank loans ($1bn); 35 weeks of outflows from European equities ($0.7bn–Charts 13-16).
BofA Private Clients: $2.8tn AUM…60.7% stocks, 20.0% bonds, 12.1% cash; ]BofA private clients flocking to bonds (short-duration), fastest pace on record ($14.1bn past 4 weeks).
BofA Bull & Bear Indicator: remains at 0.0 (Chart 1), max bearishness for 4th week on deteriorating bond flows, worsening credit technicals.
The Big Picture: Wall St disorder of 2022 reflects painful “regime change” as bullish deflationary era of peace, globalization, fiscal discipline, QE, zero rates, low taxes, inequality gives way to inflationary era of war, nationalism, fiscal panic, QT, high rates, high taxes, inclusion (Chart 4); 2020s secular investment theme is inflation; long-term charts of bonds, Swiss franc, tech, dollar-pegged Hong Kong stocks (Charts 5-8)reflecting regime change.
The Smaller Picture:2022 a simple tale of “inflation shock” causing “rates shock” which in turn threatening “recession shock” & “credit event”; inflation shock ain’t over…Sept CPI was hot & bond yields rose (expect critically in credit-event UK); core CPI has averaged 0.5% MoM past 3 months…if sustained, core CPI still 5-6% YoY late-spring 2023 (Chart 9); good news (one reason 3000-3600 the buy zone for SPX) is inflation mathematically set to fall and critically inflation to flip from “unanticipated” in 2022 (so bearish) to “anticipated” in 2023 (which will be less bearish, all other things equal).
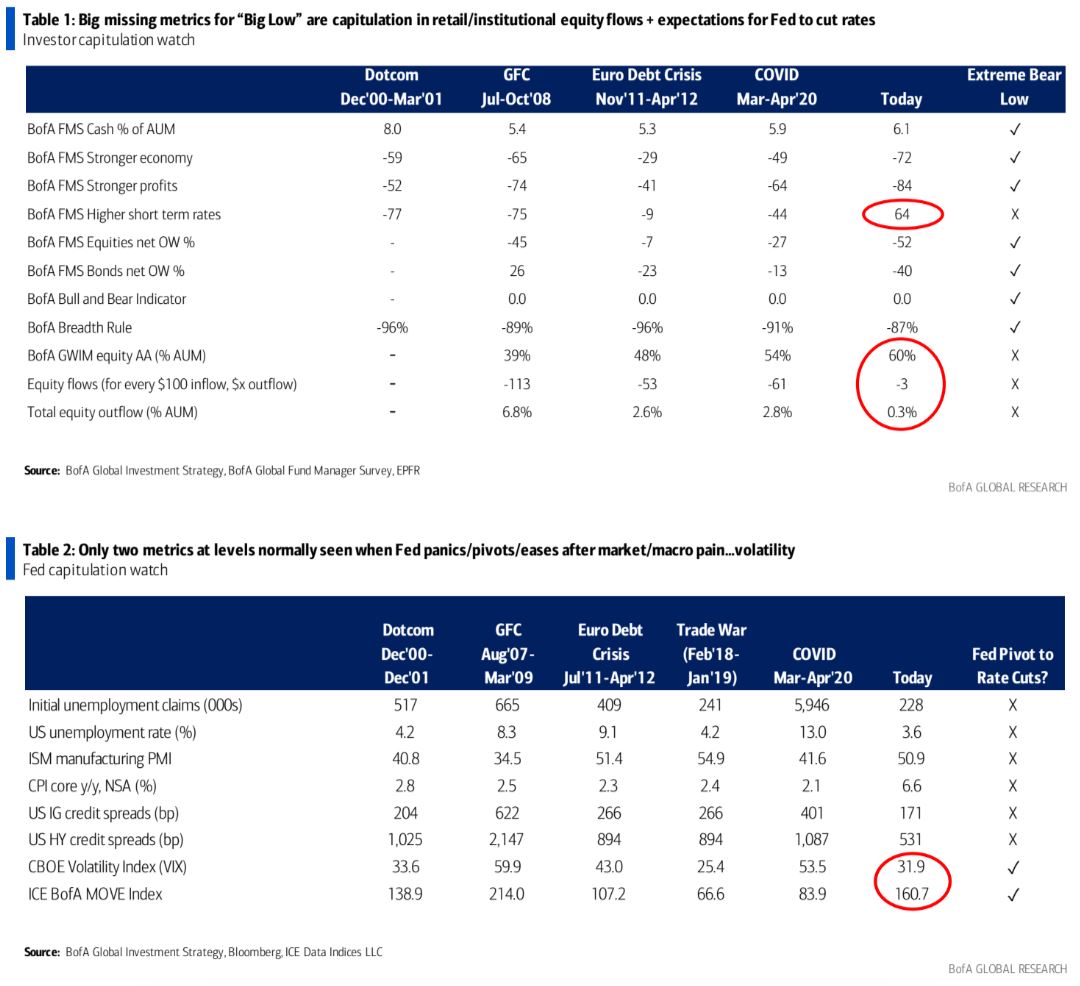
Investor Capitulation Watch: Table1 shows full capitulation in BofA Global Fund Manager Survey metrics of cash, equity allocation, economic growth, full capitulation inequity market breadth, BofA Bull & Bear Indicator; but big missing metrics are no capitulation in retail (BofA private client) or institutional equity flows; in addition at the Big Low, everyone expects the Fed to cut…just ain’t the case today; market so oversold & investors so cashed-up = decent counter-rally, but ultimate lows ain’t seen yet.
Fed Capitulation Watch: Table2 shows today the only market & macro metrics at levels normally seen when Fed panics, pivots, eases after market/macro pain is volatility of rates & maybe stocks too; labor market, ISM not weak enough; and credit spreads not telling the Fed to fold yet; the Fed panic always a necessary and often sufficient condition for the Big Low; it’s coming but not enough macro/market pain yet.