
Economist Tony Alexander has released a note explaining why he believes New Zealand’s housing bust has entered its endgame.
While house prices are still falling, the pace of decline is slowing and sales are recovering.
____________________________________________________________________________
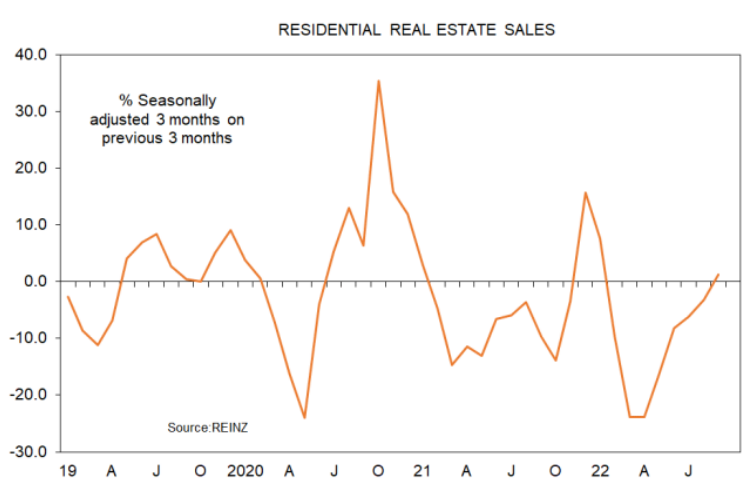
The REINZ released their monthly data this week on the state of the residential real estate market around New Zealand. Perhaps the most interesting result is confirmation of a slowing in the pace with which house prices are falling in New Zealand. On average in September according to the REINZ’s House Price Index average house prices fell by just 0. 7% in the month.
This followed a fall of 1.3% in August, 1.4% in July, and 2.1% in June. Monthly changes are shown in the following graph. Note that we are still below the zero line, so no-one can claim that the downward phase of the cycle has ended and we are going up again.
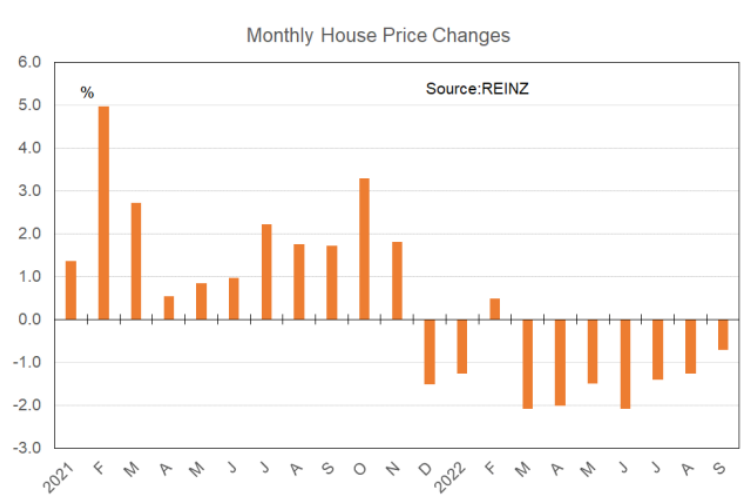
But as noted over two months ago, we are in the endgame for the period of a falling residential real estate market around the country and these latest data back up my survey results showing the return of first home buyers and reduced withdrawal of investors.
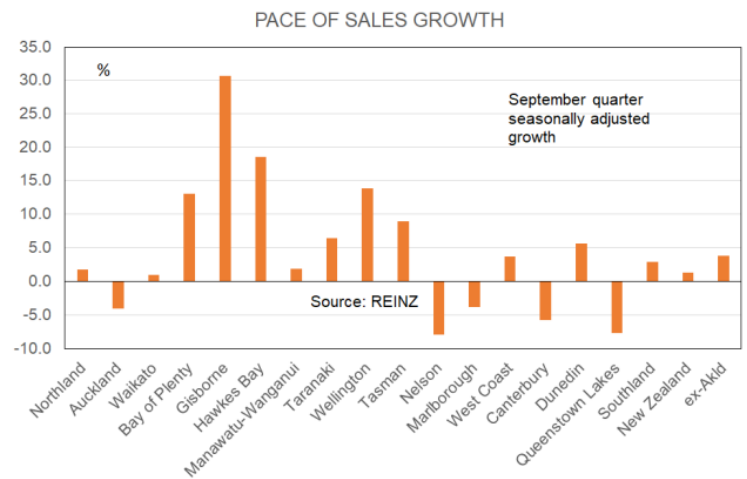
For the September quarter average NZ prices fell by 4.3% which was slightly better than the 4.8% fall over the June quarter. This means there was a 0.5% “improvement” in the nationwide price change. This data point is shown in the following graph on the far right side.
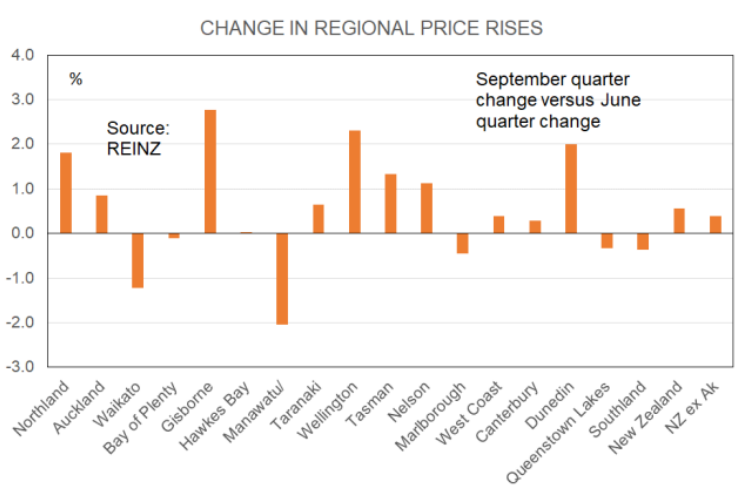
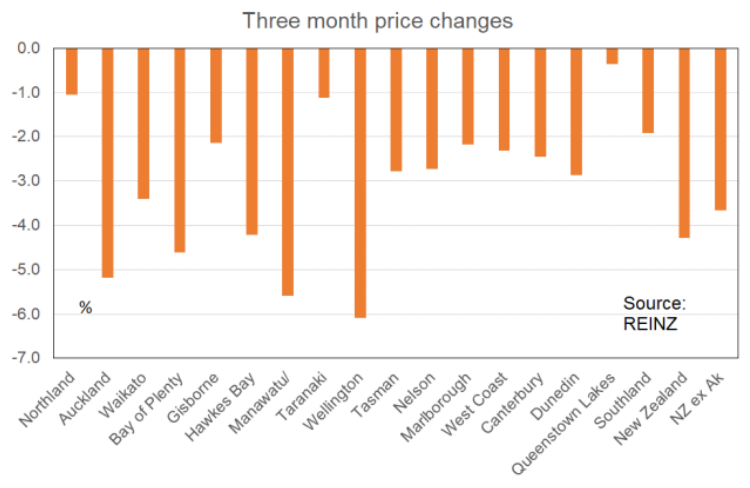
Most regions returned a better price change in the September quarter than the June quarter – shown as their orange bars being above the zero line. But some got worse, including Manawatu-Wanganui and Waikato. The actual September quarter price changes for each region are shown here. Prices have been going down in all regions recently.
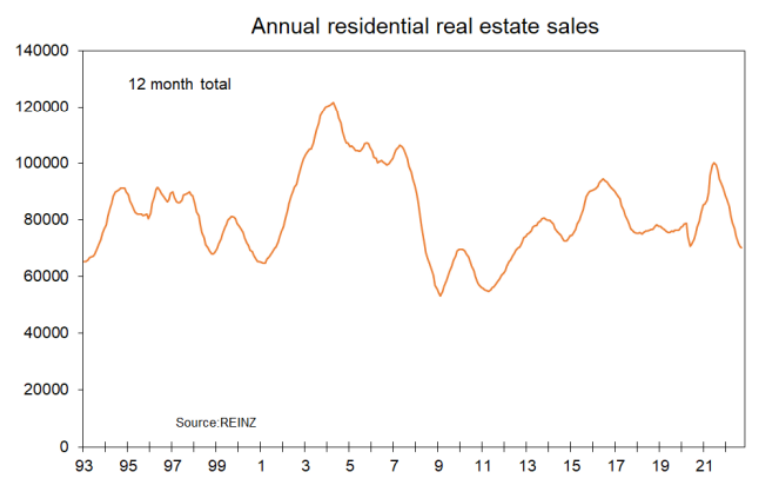
What about sales? Are they declining at a slowing pace also? At the nationwide level the answer is yes. The annual number of dwelling sales has fallen to just over 70,100 from 70,800 in August, 94,400 a year ago, and the frenzy peak of 100,100 in June last year.
In rough seasonally adjusted terms over the September quarter sales rose by 1.3% after falling 8.2% in the June quarter and 24% in the March quarter. The rolling three-month s.a. change is shown in the following graph.
It shows the frenzy period of late-2020, the weakness from early-2021 as investors backed off and first home buyers wondered what was happening, then the latter group jumping back in for a while as listings numbers fell to record low levels and FOMO went back up. Then the graph shows the weakness from early this year as the two key elements of the credit crunch hit in November and December and
FOMO collapsed.
Now, as noted some three or so months back, the endgame is underway involving the pace of price declines slowing and now sales starting to recover slightly.
Personally, I wouldn’t get too hung up on a view that sales will now trend upward. There are too many worrying factors in play including the war in Europe, upwardly biased interest rates, negative migration outflows, high cost of living increases, and talk of offshore recession.
But I’d be prepared to say that we are about near the bottom for month to month seasonally adjusted sales levels – and yes, that means the Spring effect is taken into account. That is what seasonally adjusted means.
Have sales risen on a seasonally adjusted basis in all regions? Almost, as shown here. The sales recovery is concentrated from Bay of Plenty down to the bottom of the North Island plus Tasman.
I could for the record run through data on the Days to Sell measure here. But I do not consider it all that useful when talking about turning points in the housing cycle so will give it a miss. Suffice to say, on average in September nationwide it took 47 days to sell a house compared with 37 a year earlier.
