I have absolutely no idea if this play out but the dry tinder is there. The Market Ear explores.
Pouncing on bouncing
We are very close to unleashing the mother of all buying tsunamis. The upcoming CTA buying will be enormous. Goldman Sachs reported last week that if SPX went up 6% there would be >$200bn of CTA buying. We are approaching that level quickly given the overnight squeeze . And furthermore, we are only 7 trading days away from the buyback computers being back in full force again, buying $5bn per day, every day until year end. That’s a nice $400bn of unemotional buying. Rest assure, there will be some emotional buying as well from perma-bears….
Very telling sentiment survey
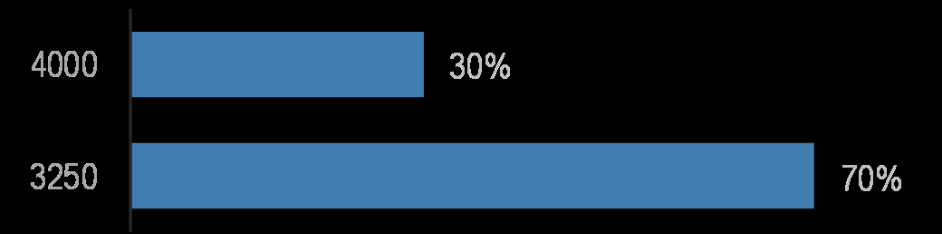
Question in JPM cross-asset survey: “Which of the following levels will the S&P 500 reach first?”
JPM cross-asset
No extreme bulls
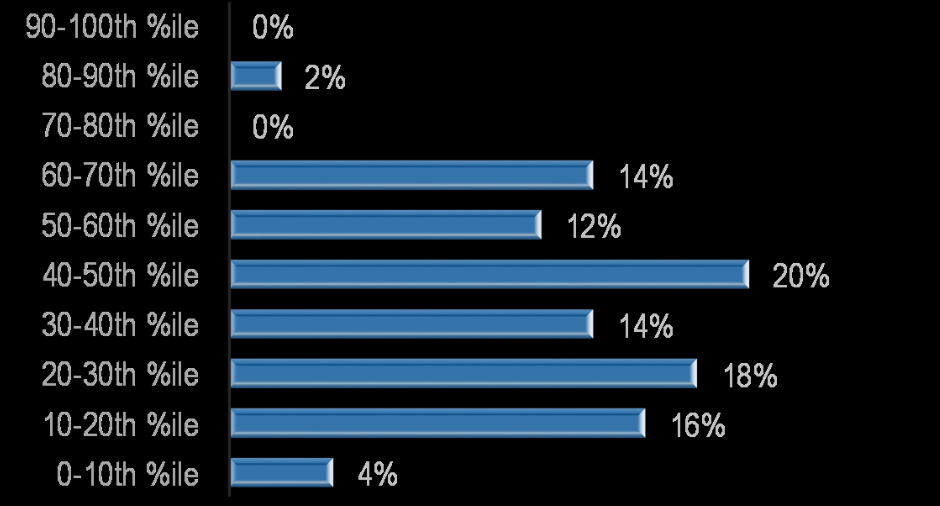
Question: “What is your current equity positioning or sentiment in historical terms, expressed from most bearish (0th percentile) to most bullish (100th percentile)?” (JPM cross-asset survey)
JPM cross-asset
Goldman’s squeeze observations
Goldman’s excellent Brian Garret points out a few important facts regarding the latest px action:
1. last week’s net selling was huge “largest since mid-june, driven by short sells vs long buys at 5:1 ratio”
2. upside crash showing upside call implied moving sharply higher
3. the crowd is short and had bought long calls for the upside crash risk scenario, but “…its likely that a lot of those expired last Fri (on the lows) and need to be redeployed”
4. TICK index printed highest levels ever
5. call volumes as percent of total exploding
SPX – first resistance taken out
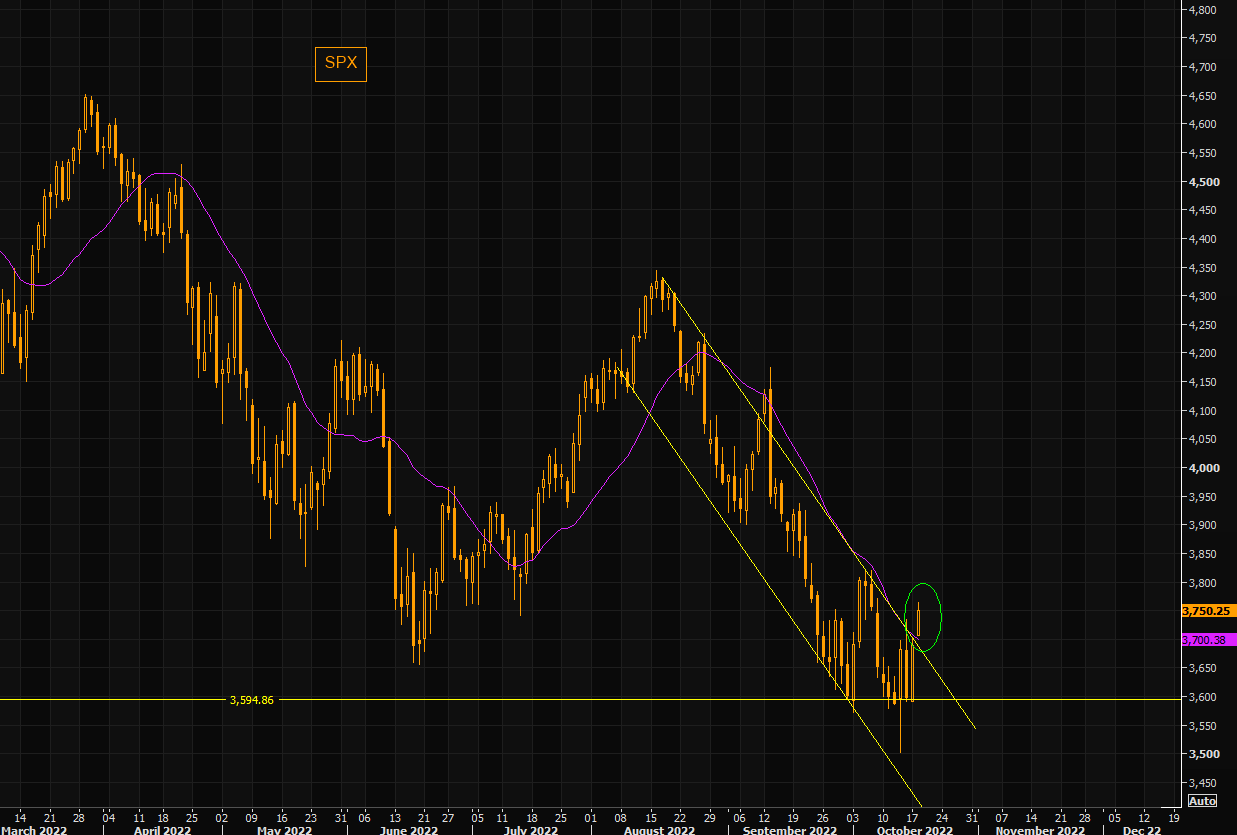
We are above the negative trend channel, the 3700 resistance and the 21 day moving average. Next short term resistance is the 3750 area, right where we are trading. Is this another false break out like we saw in early Sep, or is this something bigger in the making? One thing is sure, people are not prepared for another few percent higher from here…
Refinitiv
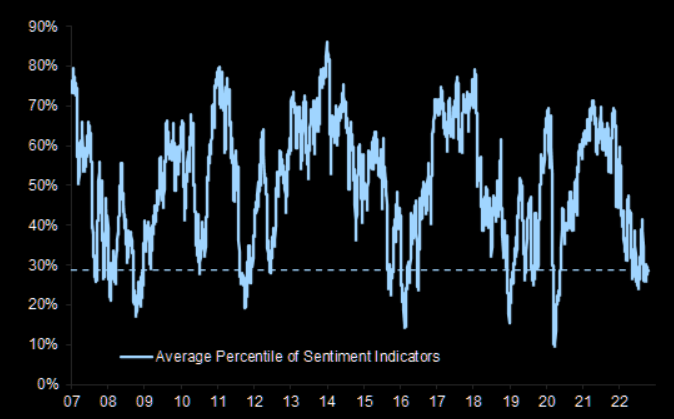
Sentiment levels associated with a bounce
Average percentile of sentiment indicators screams bounce potential.
Goldman
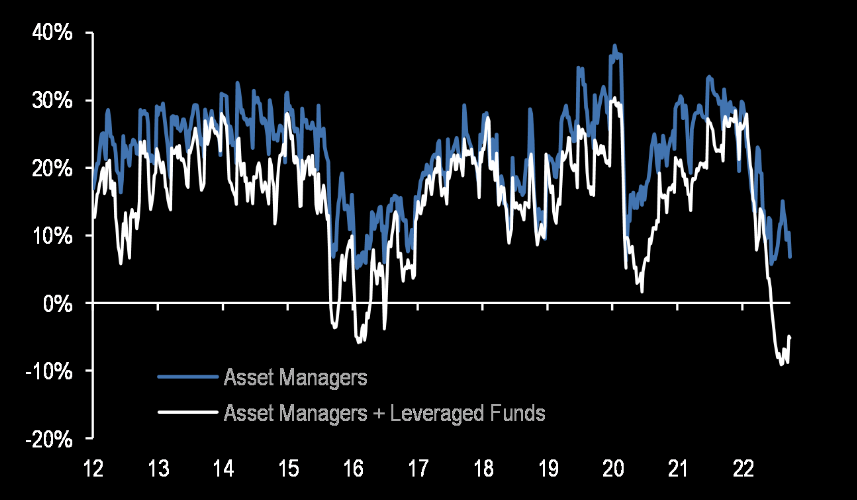
Positioning levels associated with a bounce
Positions in US equity futures by Asset managers and Leveraged funds.
CFTC
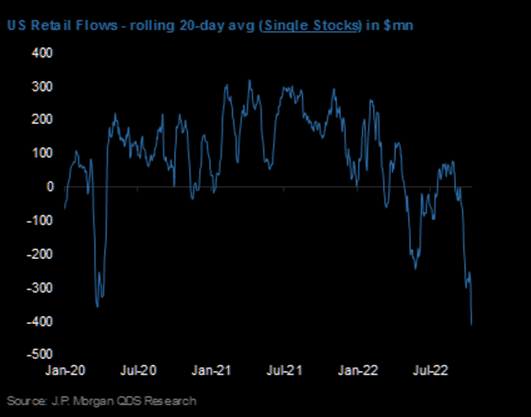
Retail puking
Rolling 20d “Net Flows” from Retail investors now below March 2020 lows.
JPM QDS
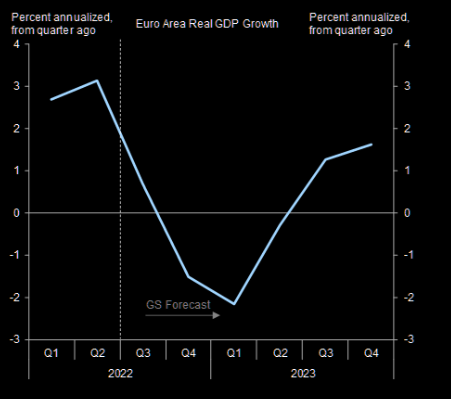
That European recession: gets better already in Q1
The epicenter of the economic “storm” wont be bad for so much longer. Looking at GS estimates, the trough is not that far away…
Goldman
Q3 earnings as a positive catalyst…
Bank of America closed up 6.1% -its best earnings reaction day since its January 2019 report. This is after 3 decent beats from mega caps at the end of last week….Maybe earnings seasons will bail out the bull once again…
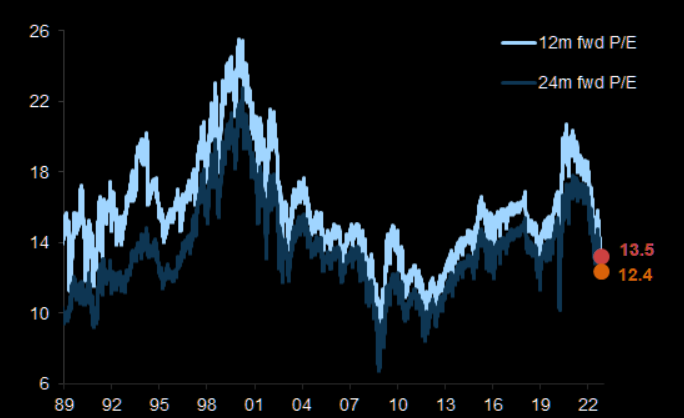
World valuation
Kind of the same level as where the “generational” bull market in 2009 started from…Chart is PE 12m and 24m fwd MSCI AC World stock valuation.
Datastream
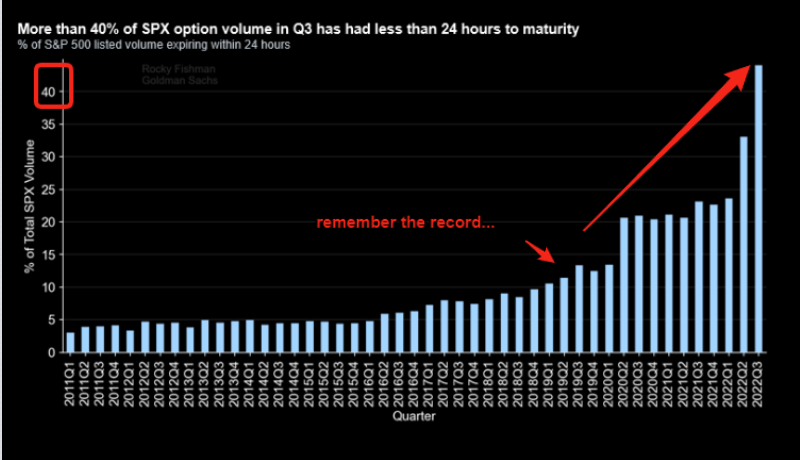
Options trading on steroids
In mid 2019 GS had a note on the phenomena of rising options trading in extremely short dated options. Back then the “record” was the fact some 12% of all SPX options expired withing 24 hours. Fast forward to today and we are close to 50% of options traded expiring within 24 hours! Options close to atm carry max gamma the closer we get to expiration, hence the seller of options trying to delta hedge will have a big impact on SPX direction. Given the fact volumes in the underlying have imploded, the effect of extreme trading in 24 hour options affects the overall market in a big way.
GS
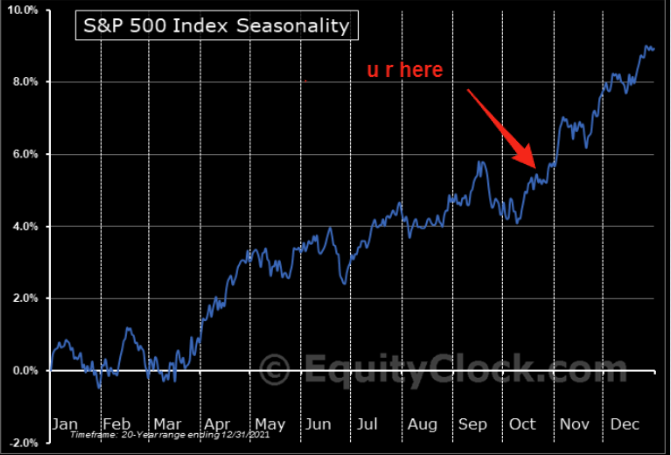
Imagine the pain…
….if traditional seasonality effect kicks in.
Equity Clock
The Fed is also sending mixed signals, Morgan Stanley.
The Fed’s tone is getting cautious about continuing to extrapolate higher rates. Additionally, with 4 x 75bp hikes locked in (assuming 75bp in November), and likely another 50/75 in December, we think the Fed will emphasize the idea of waiting to see the “long and variable lags” from rate hikes affecting the economy.
September minutes: Several participants noted that, particularly in the current highly uncertain global economic and financial environment, it would be important to calibrate the pace of further policy tightening with the aim of mitigating the risk of significant adverse effects on the economic outlook
Lael Brainard’s comments: In light of elevated global economic and financial uncertainty, moving forward deliberately and in a data-dependent manner will enable us to learn how economic activity, employment, and inflation a readjusting to cumulative tightening in order to inform our assessments of the path of the policy rate.
Neel Kashkari’s comments: I think a much more likely scenario is we will raise to some level north of 4%, maybe 4.5%,and then pause and sit there for an extended periodof time while the tightening we’ve already done works its way through the economy.
Esther George’s comments: While my expectation is that rates are going to have to move higher for a sustained period, I do see risks around moving too abruptly to this new higher level. Moving too fast can disrupt financial markets and the economy in a way that ultimately could be self-defeating,
And Nomura’s Charlie McElligott notes the similarity to the last rally in terms of earnings.
But here we go again into EPS:The “Q3 Earnings as the next (negative) ‘shoe to drop’ for Equities” thesis is again treading on thin-ice into the meat of earnings season next wk, where similar towhat we saw in Q2 EPS(which precipitated / “juiced” the Summer Stocks rally),Bank earnings from JPM, WFC and BAC are showing that the 1) US Consumer refuses to crack,with credit card delinquencies stuck near the lows and net charge-off rates declining to historic lows themselves, despite card spending increases;and simultaneously, 2) that inflation continues to act as a TAILWIND for Corp Earnings via pricing-power being exhibited (PEP avg prices +17% in Q3 vs Sales Volumes only -1%!),as said resilient Consumer continues to “make it work” and spend, digesting price increases
Perversely then in the “NOW,”we see high Inflation paired with Commods prices relatively softer off the highs is then leading to a virtuous “sweet spot” environment for Corporate marginexpansion
With Inflation where it is, US Nominal GDP is over 10%…so top line growth stays spicy, which in conjunction with Wage Growth at ATH and overall Employment remaining “hot” then continues this “Schrodinger’s Economy” tension:current dynamics show “still relatively strong economic conditions” (where anecdotally, Restaurants, Malls, Airports, Concerts remain “foaming at the mouth”)…but awkwardly then juxtaposed against those consensual “hard landing / recession” forwards in the market, as inflation gets stickier and expands into Services, while “lagged and variable” implications from the FCI tightening gradually bleeding the economy, causing the u-rate to move higher along with default rates
The current “average” Consumer is seemingly able to handle losses in their “securities portfolios / 401k accounts” in a vacuum (especially when those are quoted on mulit-year return basis, i.e. SPX+14% and NDX still +27% since start 2020!) when their Home values are still largely sitting near high, and most importantly, they remain employed, with recent wage increases to boot
But the future instability comes when “2 of the 3”…or “all 3” of the above factors begin working against the Consumer—i.e. that securities portfolio is getting beaten-up AND they lose their job at same time and / or their house Equity collapses—THEN the calculus changes…but that isn’t “now” just quite yet…
Even the very bearish Michael Wilson at Morgan Stanley is on board.
Last week’s infatuation with CPI/PPI may be a trap for the inflation bulls. The 200-WEEK moving average is a serious floor of support until companies fully confess or a recession officially arrives, both of which could take several more months and lead to a technical rally in the short term.
Technicals May Gain Upper Hand on Fundamentals….last week’s inflation reports did not disappoint those looking for confirmation inflation remains a problem. However, these data are some of the most backward looking economic series and tell us little about the future. In our view, inflation has already peaked and could fall rapidly next year as comparisons become very difficult and discounting returns. This would argue for lower back end rates, which could be supportive for stocks until the earnings are cut as we expect and/or a full blown recession arrives. A tradable tactical rally looks likely,as the 200-week moving average is strong technical support until the Ice sets in.
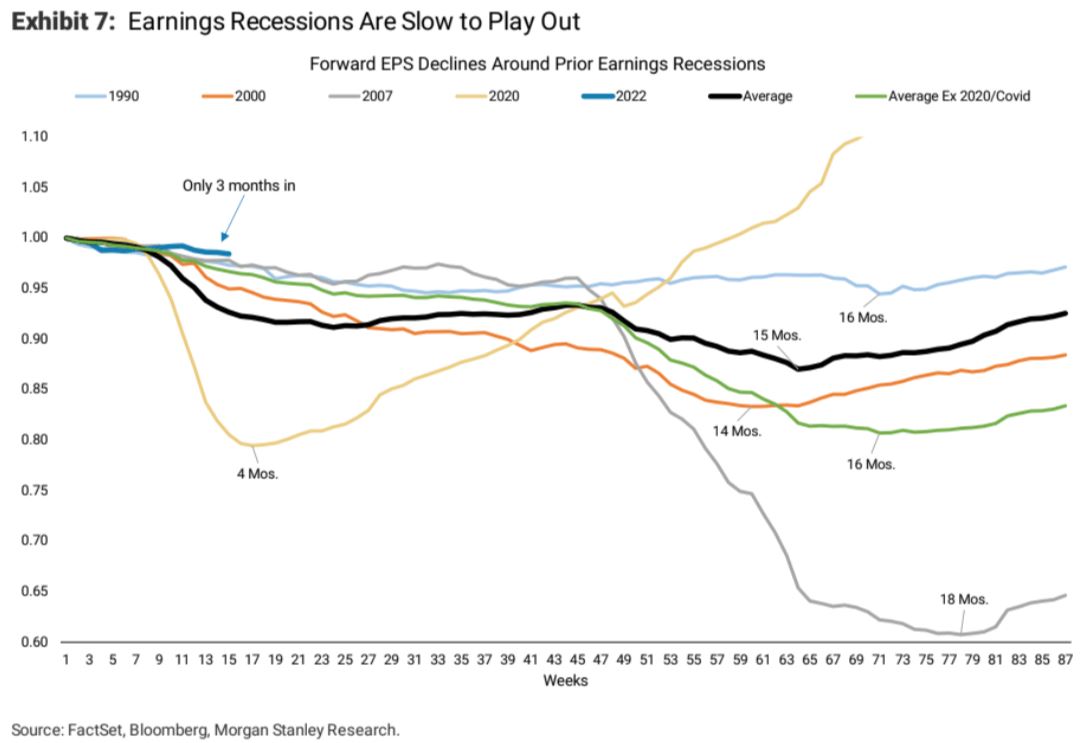
Earnings recessions are slow to play out… prior earnings recessions have taken 15 months to play out, on average. While it feels like this downward EPS revision cycle has been in process for a long time, we’re only about 3 months in from the early July peak in numbers. As we have written about extensively over the past 2 months, our top down leading earnings models are pointing to an acute and material earnings deceleration over the next 12 months. However, it typically takes time for bottom-up consensus expectations to reflect the top-down earnings risk. We’ve seen the market multiple discount the earnings downside somewhere between ~40-50% of the way through the EPS compression. Given the speed of this cycle, we think the duration of this earnings downdraft could be shorter than average. All in all,history points to the next 3-4 months as the window to fully discount the earnings recession.
If markets do run then the FCI easing will short-circuit it in due course. Inflation is still glued above 5% core: