

The Bank of England stepped into the bond market as UK gilts collapsed following the disastrously stupid Truss economic “plan” saw a big rush on Pound Sterling. This overshadowing the ongoing war/Nordstream/recession trifecta of concerns in Europe and saw a reversal in USD, with Euro lifting to a weekly high, but still well below parity. Other undollars came back alongside, with stocks rebounding on the seemingly risk-on move, with Wall Street up more than 2%, which should lift Asian stocks today. 10 year US Treasuries pushed above the 4% level with interest rate expectations still looking at another 150bps in rises by January. Commodities lifted with oil markets coming back after recent sharp falls, as Brent crude moved back up to the $88USD per barrel level while gold also bounced off its recent monthly low to finish overnight at the $1660USD per ounce level.
Looking at share markets in Asia from yesterday’s session where mainland Chinese share markets sold off sharply with the Shanghai Composite down 1.5% to 3045 points while the Hang Seng Index was crushed, down another 3% at 17250 points. The daily futures chart is still showing a very bearish mood with a bear market continuing as daily momentum remains well deep into negative funk, but showing signs of selling exhaustion here: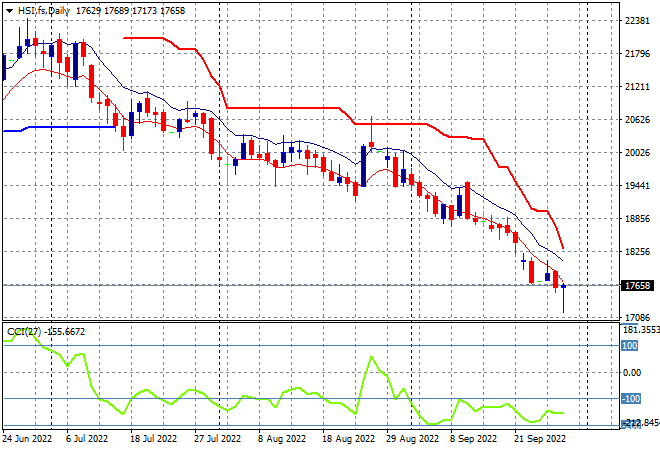
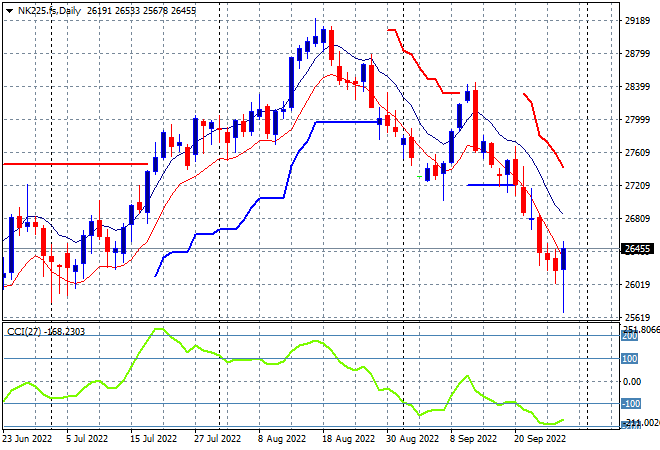
Japanese stock markets also stumbled, with the Nikkei 225 closing some 1.5% lower at 26173 points. The daily chart shows price action still on a dominant downtrend after the recent dead cat bounce up to the 28000 point level with support at the 27000 point level a distant memory. Daily momentum remains negative and oversold with successive new daily low sessions pointing to a test of the June lows. However, futures are indicating a strong bounce today with a big level of support formed at the 25500 point level:
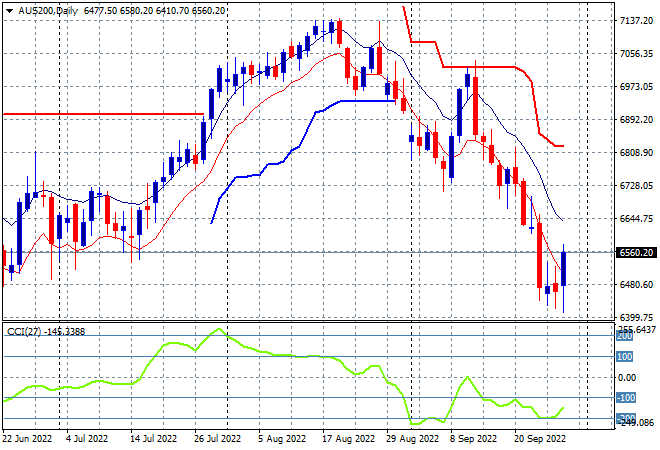
Australian stocks were the best in the region, all things being equal, with the ASX200 only losing 0.5% to close at the 6462 point level, hovering at a new monthly low. SPI futures however are indicating a big bounce of 1.5% or more in response to the roaring back of Wall Street after so many negative session. The daily chart shows price action testing the June lows next as daily momentum swings back from full oversold mode, as buying support builds here. Watch for any break above the high moving average here as a new swing play:
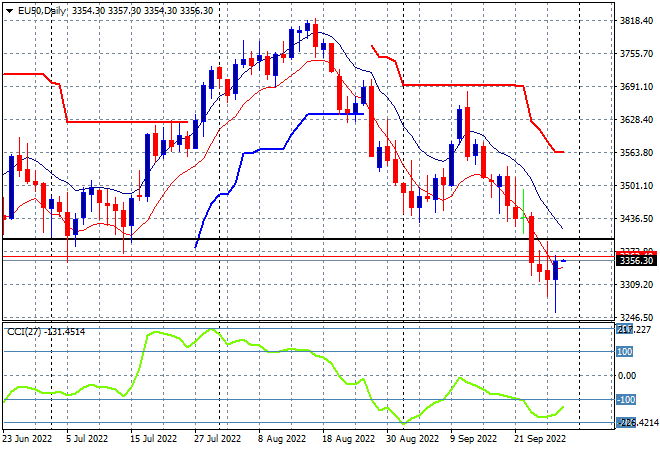
European stocks finally stopped piling on the losses with a mild bounceback in open trade that saw most continental markets up around 0.3%, with more gains in post close futures. The Eurostoxx 50 Index eventually finished 0.2% higher at 3335 points overnight with the daily chart showing price action overextending below the June lows at the 3300 level. There is a small growing possibility of a swing higher on the back of the BOE actions, but its very early days as daily momentum remains well oversold:
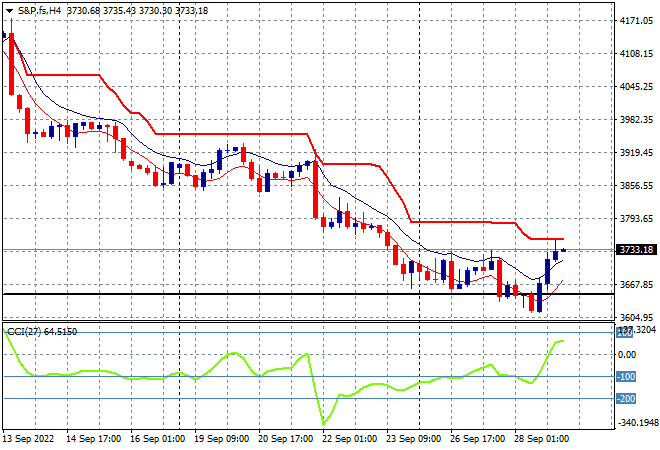
Wall Street had big returns after being hesistant all week to support any buying efforts, although the NASDAQ did first point to a possible bounce in the previous session. The tech index gained more than 2% while the S&P500 finished nearly the same higher at 3719 points. The four hourly chart remains on a steady downtrend similar to all other major stock markets with key trailing ATR resistance not yet breached. While price has now returned to the June lows (lower black line) which wipes out all of 2021’s returns, momentum had been indicating some deceleration here so watch for support to possibly hold:
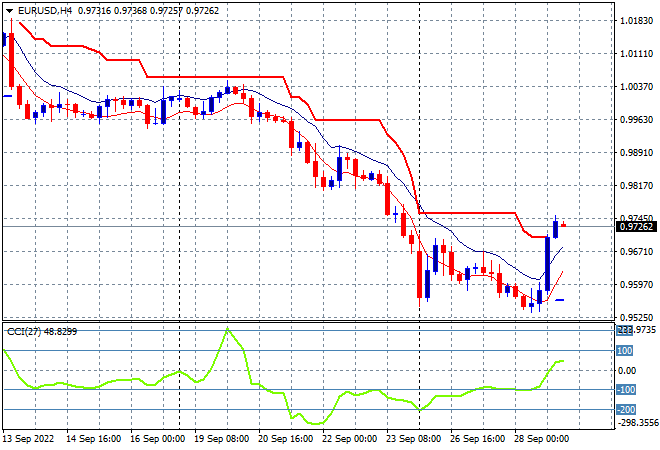
Currency markets were so firmly on the side of the USD its not unexpected that any catalyst could see a swing against King Dollar with the reversal in Pound Sterling and Euro taking back over a week of losses overnight. The union currency’s got back to the 97 handle and above four hourly resistance but notably only takes it back to last Friday’s opening level. Momentum has swung from very oversold settings with the four hourly chart indicating selling pressure easing off as support builds just above the 95 handle. With price above the high moving average and just above short term resistance this is setting up for a swing play only so far:
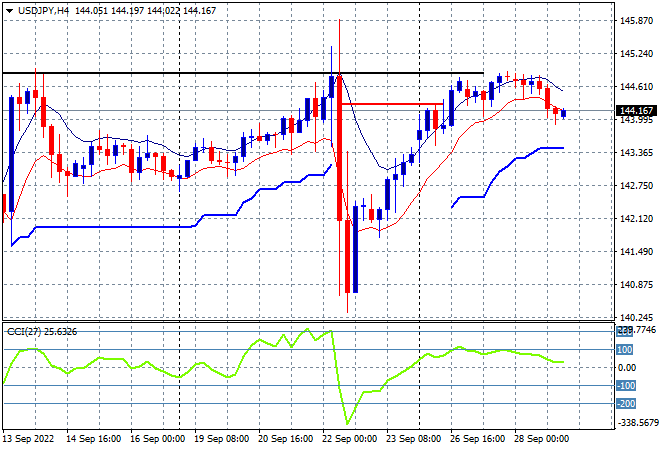
The USDJPY pair reversed its slow melt up and fell back to the 144 handle overnight in a relatively mild move versus some of the other undollars. Short term momentum has retraced from being barely overbought to a neutral setting, with price rebuffing against obvious resistance at just below the 145 level where its likely to be rebuffed as before, although no new session lows is promising:
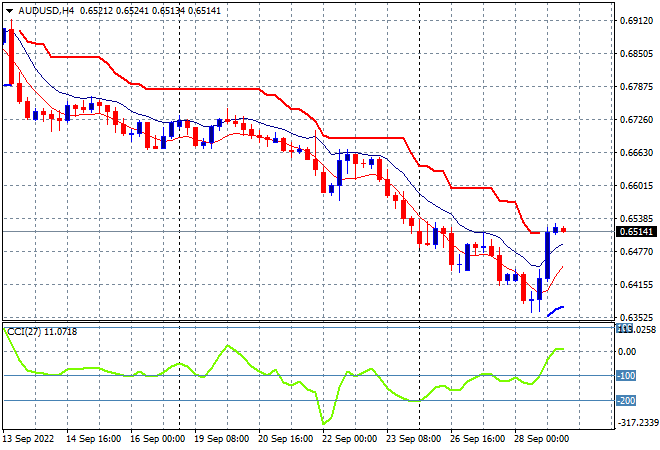
The Australian dollar zoomed higher alongside other undollars, heading smarly back above the 65 handle after almost cracking through the 64 cent level in the previous session, moving in line with risk markets. This doesn’t change my contention that resistance is just too strong at all the previous levels with the 68 handle still the area to beat. This swing play has the potential to get back to the 66 level is the area to watch but not much above that:
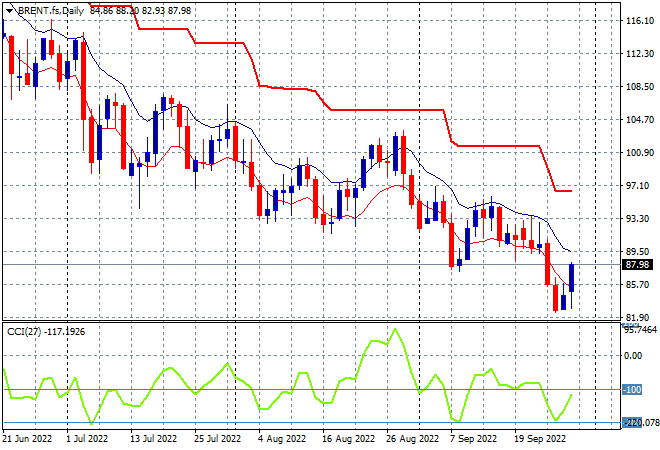
Oil markets also came back after a series of attempts to stabilise after its collapse on Friday night, with Brent crude lifting over 2% to the $88USD per barrel level overnight. I still contend that this is still a minor move given that daily momentum had been persistently negative with price action not yet above the high moving average with short term resistance at the $96 level still quite firm:
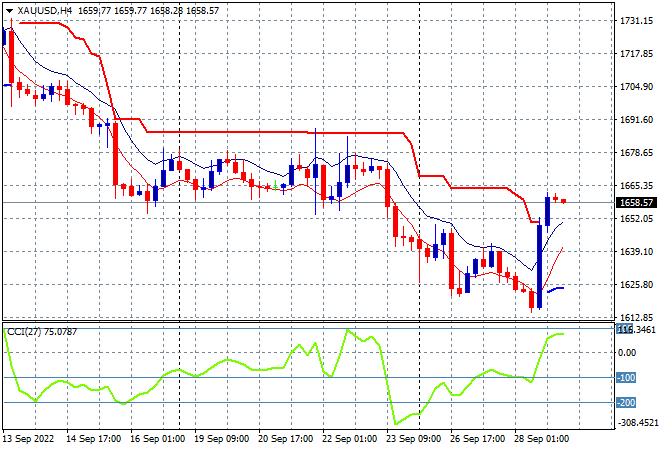
Gold had a sharp move higher in line with other undollars to finish at the $1658USD per ounce level overnight. This immediately took the shiny metal off the 2020 lows but still doesn’t negate the multi-monthly bearish setup with short term resistance at the $1700 level not yet under threat:
Glossary of Acronyms and Technical Analysis Terms:
ATR: Average True Range – measures the degree of price volatility averaged over a time period
ATR Support/Resistance: a ratcheting mechanism that follows price below/above a trend, that if breached shows above average volatility
CCI: Commodity Channel Index: a momentum reading that calculates current price away from the statistical mean or “typical” price to indicate overbought (far above the mean) or oversold (far below the mean)
Low/High Moving Average: rolling mean of prices in this case, the low and high for the day/hour which creates a band around the actual price movement
FOMC: Federal Open Market Committee, monthly meeting of Federal Reserve regarding monetary policy (setting interest rates)
DOE: US Department of Energy
Uncle Point: or stop loss point, a level at which you’ve clearly been wrong on your position, so cry uncle and get out!wrong on your position, so cry uncle and get out!