
CBA with the note.
New monthly inflation data suggests 1.6%/qtr Q3 22 CPI.
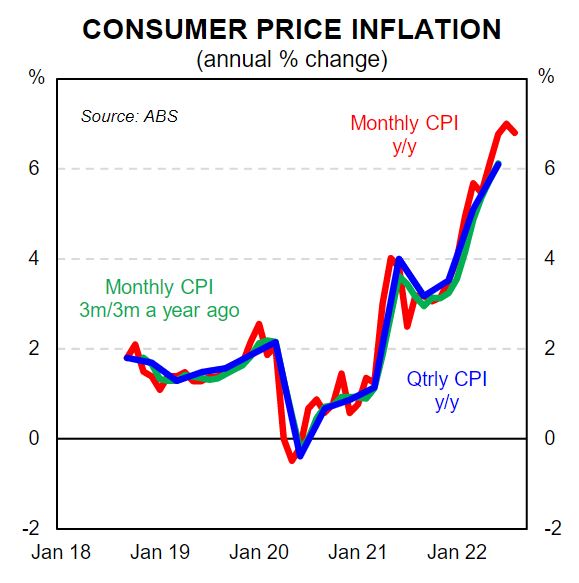
| ■ | The new ABS monthly CPI indicator rose 6.8%/yr to August 2022 (the annual rate stepped down from 7.0%/yr in July 2022). |
| ■ | Based on today’s inflation data we expect the Q3 22 CPI to increase by 1.6%/qtr which would take the annual rate to 7.0% (this is marginally higher than our previously published preliminary forecast of 1.5%/qtr and 6.9%/yr). |
| ■ | The annual rate of inflation will continue to lift but the quarterly pulse of headline and core inflation has not accelerated and we expect inflation to slow considerably in 2023 (we expect it to fall back to the top of the RBA’s target band by late 2023). |
| ■ | We stick with our call for the RBA to slow the pace of tightening at the October Board meeting and to raise the cash rate by a ‘business as usual’ 25bp which would take the cash rate to 2.60%. |
Inflation is elevated, but perspective required
The ABS today released new monthly CPI data. The data covered the months of July and August 2022. The data was not accompanied by a time series which limits the capacity of economists to fully dissect the information. Notwithstanding the data contained in the release helps us to more accurately forecast Q3 22 CPI.
Based on today’s release we expect the Q3 22 CPI to increase by 1.6%/qtr which would take the annual rate to 7.0% (this is marginally higher than our previously published preliminary forecast of 1.5%/qtr and 6.9%/yr).
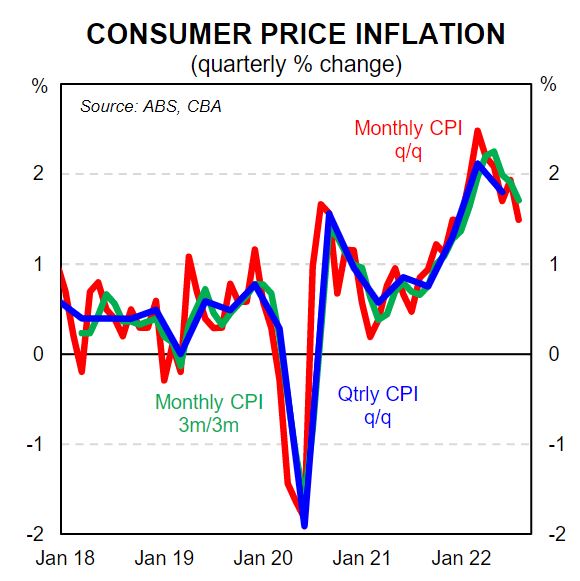
Such an outcome would mean the quarterly pace of headline inflation has not accelerated, but rather slowed (recall Q1 22 CPI rose by 2.1%/qtr and Q2 22 CPI increased by 1.8%/qtr). Underlying or core inflation looks to be holding at an annualised pace of 6.0% ‑ i.e. ~1.5% a quarter).
The upshot is that Australia’s inflation ‘problem’ is not getting worse. Indeed things will improve from here as the lagged impacted of rate hike slows domestic demand growth in the economy.
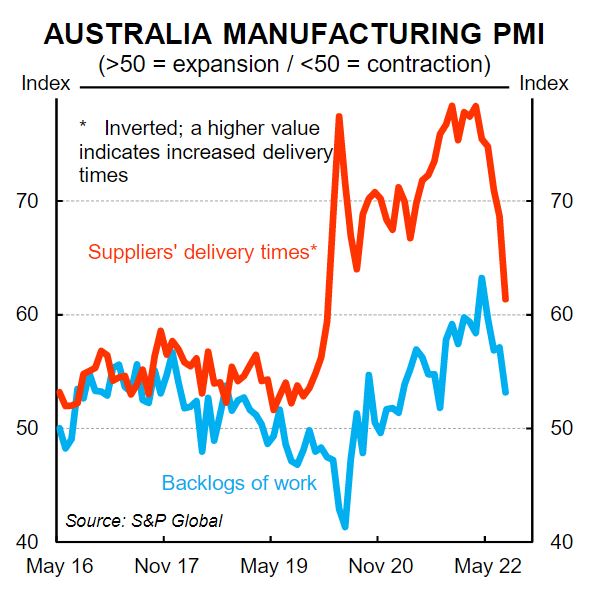
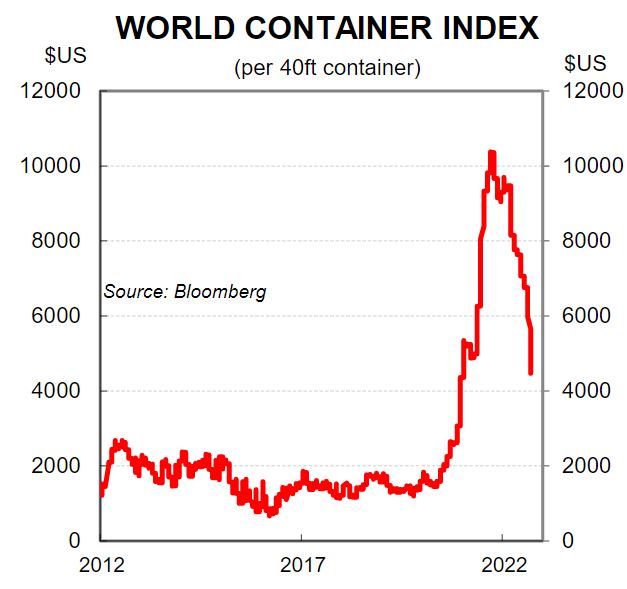
The global picture has also improved on the inflationary front which has implications for Australia. Commodity prices have fallen significantly over the recent past, shipping costs are declining and delivery times have shortened. In summary the supply side of the global economy is gradually improving at a time when the demand for goods will slow. The US is in a different place to Australia given high wages growth is driving services inflation. But in Australia the data today indicates services inflation remains reasonably well contained (consistent with annual wages growth of ~3.0%). See here for a note published earlier today by Belinda Allen on wages in Australia.
The detail in today’s release indicates that non‑discretionary inflation continues to be the dominant driver of Australia’s elevated rate of inflation. Fruit and vegetable prices, for example, rose by 18.6% over the year to August 2022 (up from 9.1%/yr in June 2022). This primarily reflects adverse weather conditions, including the east coast flooding, which affected the availability of some items. The large increase in food prices indicates that the recent strength in retail spending contains a large element of price rises as opposed to higher volumes. Some food prices will fall from here.
In parsing today’s partial release of the monthly CPI indicator it is important to note which prices were not measured. The prices of these goods and services not measured were held constant, i.e. an inflation rate of 0%. Where we think that matters most for the Q3 22 print is utilities and childcare prices, both of which are measured in the September month.
In terms of utilities, two key drivers are electricity and gas. Government electricity rebates in some states (notably WA and QLD) will see prices paid by consumers fall. Somewhat offsetting will be gas price increases across the east coast that will contribute to inflation in Q3 22.
Childcare prices are also expected to rebound solidly in Q3 22 after falling by 7.3% in Q2 22 as child care subsidies and vouchers reduced out‑of‑pocket expenses.
The first full monthly CPI indicator publication, including data from 2018 up to and including September 2022, will be released on 26 October 2022 alongside the September quarter CPI publication. See over the page for a primer on the monthly CPI.
Today’s inflation data and the RBA
Last week RBA Deputy Governor Michelle Bullock was asked two questions specifically about today’s inflation data:
Question one: “Later this month, we’ll have the first monthly inflation report, so everybody is pretty excited to see what the numbers are going to be. Do you have expectations around what the number will be, and is there a certain figure that will really worry you?”
Michele Bullock: “No, we don’t. I think there’s a little bit of water under the bridge to go with the monthly CPI numbers. I think everyone will be looking at them and trying to figure out what is the noise and what is the information in the monthly figures. So I’m not so sure that, quite immediately, we will be looking at monthlies. What I would say is that our forecasts for inflation are to peak at about 7¾ per cent to eight per cent towards the end and early into next year, so those are the numbers we’re currently working with. We’ve got new forecasts coming out soon in the November Statement on Monetary Policy. But that’s our current expectation and that’s what we’re working with.”
Question two: “So it will not … these monthly figures, these won’t have monetary policy implications for the October meeting.”
Michele Bullock: “I think it’s unlikely because at the moment there needs to be a little bit of water under the bridge with the monthly numbers to see what sort of information content is in them, because they’re not the full CPI.”
A literal interpretation of the Deputy Governor’s remarks mean that today’s inflation figures are of little consequence to the RBA’s decision at next week’s Board meeting. However, we believe behind closed doors the RBA will welcome the data. There was a risk that the inflation data today indicated the pulse of inflation accelerated or came in stronger than the RBA anticipated. But the data is likely to have come in below the RBA’s expectations. The RBA’s expectation for inflation to peak at 7¾‑8% implies quarterly increases of ~1.8% in CPI over the next two quarters. Today’s data points to a softer increase as discussed above.
The level of the AUD is also not a problem from an inflationary perspective. It’s depreciation against the USD is well documented. But the AUD has held up on a trade weighted index (TWI) basis. Imported inflation is more closely correlated with the TWI than the AUD.
We stick with our call for the RBA to slow the pace of their tightening cycle at next week’s Board meeting and to raise the cash rate by a ‘business as usual’ 25bp.
A primer on the monthly CPI indicator
The introduction of a monthly CPI figure is a welcome addition to the suite of economic data produced by the ABS. It allows a timelier read of the inflationary pulse – particularly important at the current high‑inflation juncture.
However, the ABS notes that this is an “indicator” of inflation rather than a measure of inflation because there are “some deficiencies relative to the quarterly CPI”. The quarterly CPI index remains the key benchmark measure for inflation in Australia.
So it is important to understand how and why the monthly CPI indicator can differ from the quarterly figure. The key point of difference is that the frequency of price collection differs across the CPI basket.
Specifically, not all categories in the CPI are measured on a monthly basis. In some cases that is not a concern as not all prices change that frequently; property rates and education fees for instance tend to only change once a year. In other cases, prices can and do change monthly (or even more frequently). But some of these prices are only collected quarterly. More detail on the frequency on collection of each category and the timing can be found here in Appendix One.
The ABS has decided that for those items where prices are collected quarterly, prices collected in previous months will be “carried forward” until a new price is collected. For any given month, the share of the CPI basket where data are carried forward (i.e. not updated) is between 27–38%. So while the entire CPI basket is included in each monthly figure, there is a substantial share of items where their prices are simply held constant until new prices are available. As a consequence the three‑month average of the monthly CPI indicator will not equal the quarterly CPI index.
Nonetheless, the upshot is that the monthly CPI indicator does closely track the quarterly CPI series on an annual basis. However, looking at month‑on‑month changes can be problematic due to the seasonal nature of price changes in some categories. The ABS will produce a seasonally adjusted monthly series as well as trimmed mean and weighted mean measures from the full release of the monthly CPI indicator beginning next month.
