
Risk sentiment stumbled overnight with strong UK inflation numbers offset by the release of the latest FOMC minutes later in the session but it still resulted in falls on both sides of the Atlantic with the USD rising against the major currencies again. Euro escaped any further selling while the Australian dollar slumped well below the 70 cent level as traders weigh up today’s unemployment print. Bond markets saw more roundtripping of yields with 10 year Treasuries eventually finishing just below the 2.9% level while interest rate futures also still showing 120bps in rate rises factored in by the end of 2022 with at least 50bps coming in September’s meeting. Commodity prices continued to deflate with WTI and Brent crude slipping while gold remains unable to get back above the $1800USD per ounce level, making a new daily low.
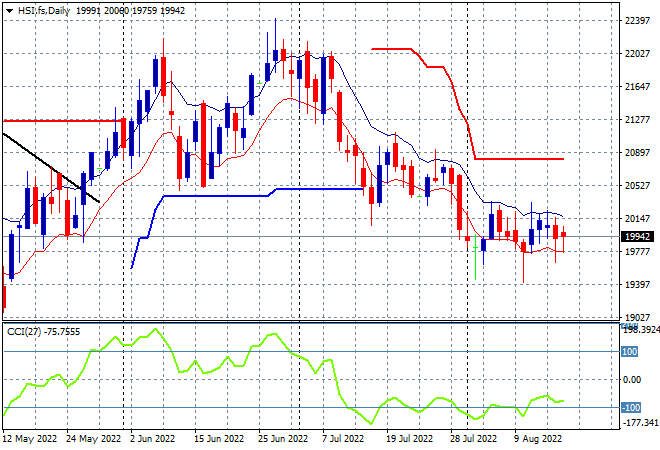
Looking at share markets in Asia from yesterday’s session, where mainland Chinese share markets are finally finding some buyers Shanghai Composite lifting 0.4% into the close at 3292 points while the Hang Seng Index has bounced back, up 0.5% to 19942 points. The daily chart is still showing considerable overhead resistance and daily momentum readings remaining quite negative as the moving average channel moves sideways without any upside pressure however. The May lows could come under pressure soon if there is another break below the low moving average:
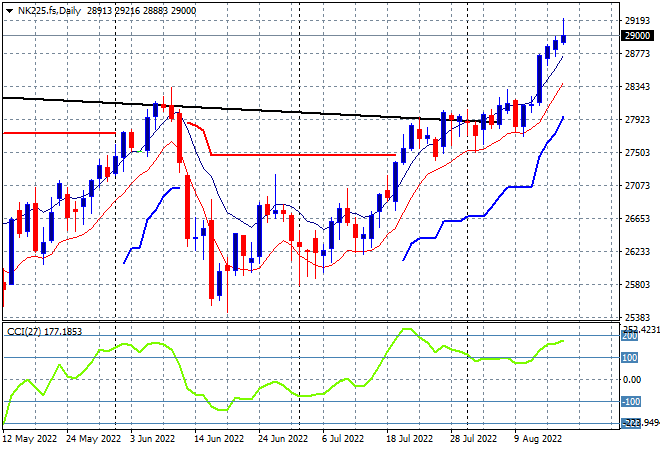
Japanese stock markets are doing all the heavy lifting however, with the Nikkei 225 surging more than 1.2% to close at 29222 points. The daily chart still shows a nice breakout here after finally clearing resistance at the previous highs at 28000 points with daily momentum remaining well overbought, although the recent daily candle is technically a one-day bearish reversal pattern. The overall monthly/weekly downtrend (sloping black line above) seems to be broken here after price action bunched up for so long so with very positive risk sentiment now, watch the 28000 point level to turn into support next:
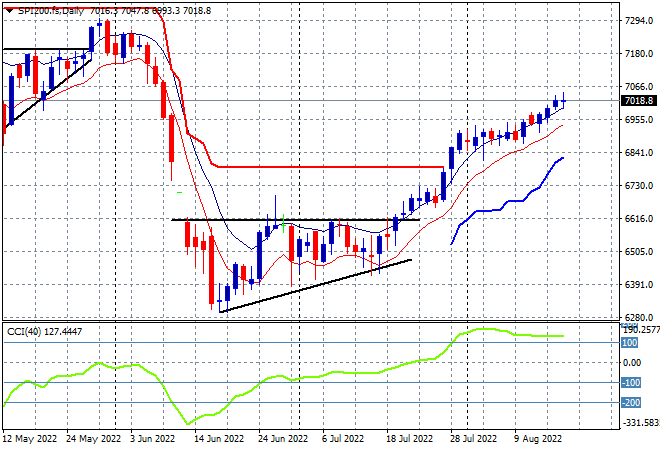
Australian stocks were the relative worst in the region with the ASX200 closing just 0.3% higher at 7127 points. SPI futures are down fractionally on the poor lead from Wall Street overnight although its likely to result in a steeper selloff on the open. The daily chart continues to look firm here with the short term breakout situation converting into something more sustainable with resistance now put aside. Daily momentum remains nicely overbought with the potential for more upside action if it can hold on to the 7000 point level:
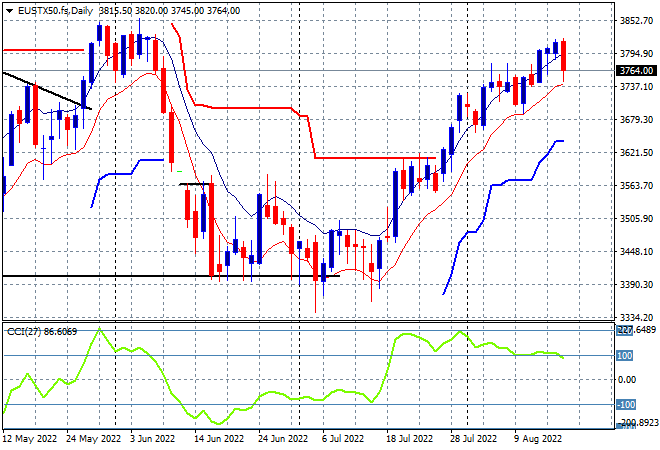
European stocks had some disparate results across the continent with the German DAX slumping more than 2% while the FTSE had a mild 0.3% retracement. This still led the Eurostoxx 50 index to close more than 1.2% lower to 3756 points, stalling its recent rally. The daily chart shows price action having moved sharply higher through overhead resistance last week as overbought daily momentum now comes up against stiff resistance at the 3800 point level. Price action has definitely decelerated – look at the low moving average line and also daily momentum has crossed below overbought reading. The May highs at the 3850 point level may be out of reach:
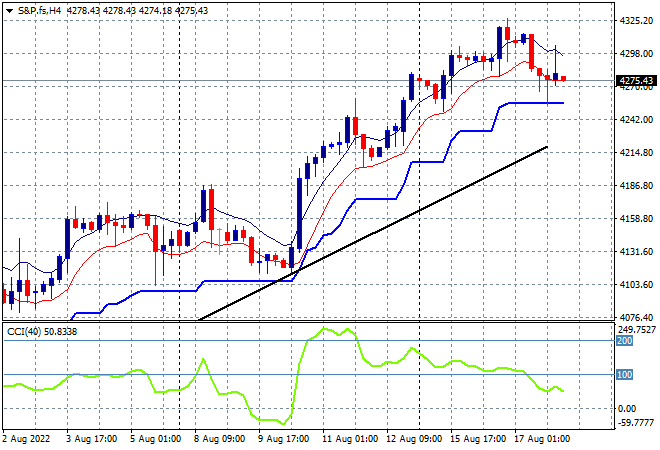
Wall Street also fell back with the NASDAQ pulling back the most, down 1.2% while the S&P500 finished some 0.7% lower at 4274 points. I had noted that price action was getting ahead of itself with the four hourly chart showing the trendline from the lows creating a gap that was likely to be closed with this sort of retracement. Price is still above the May highs with short term momentum now crossing below previously overbought positions so watch for the ATR support level at 4250 points that could come under pressure next:
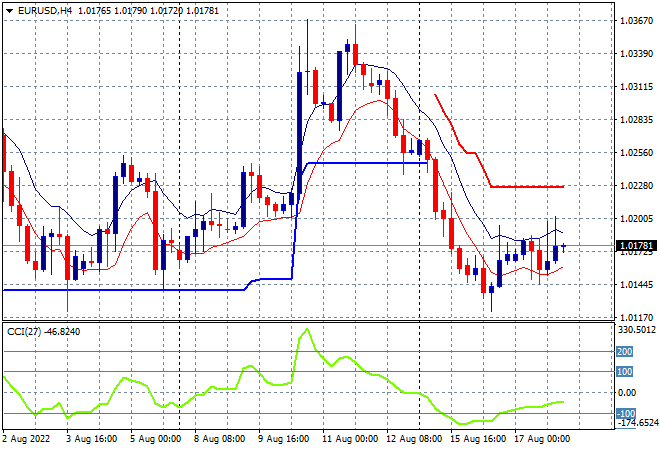
Currency markets remain in strong USD mode but Euro finally stabilised overnight after some strong selling through the week. The union currency is still trying to push back up towards the 1.02 handle but was thwarted again and remains contained here. Momentum on the four hourly chart has retraced from oversold readings but remains negative, with price action still unable to close above the high moving average which suggest lack of upside in the short term:
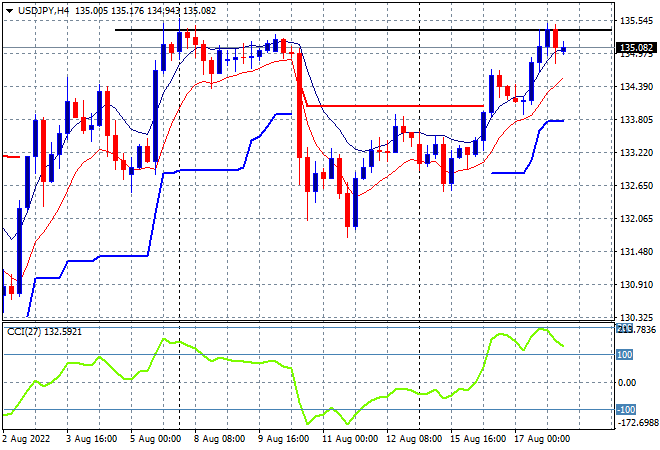
The USDJPY pair paused its breakout above short term resistance at the 134 handle overnight, reaching the 135 level that equates to former weekly highs. Internal buying support is still looking good here with short term momentum remaining nicely overbought. This still sets up for another attempt at the previous weekly highs at the 135.50 area:
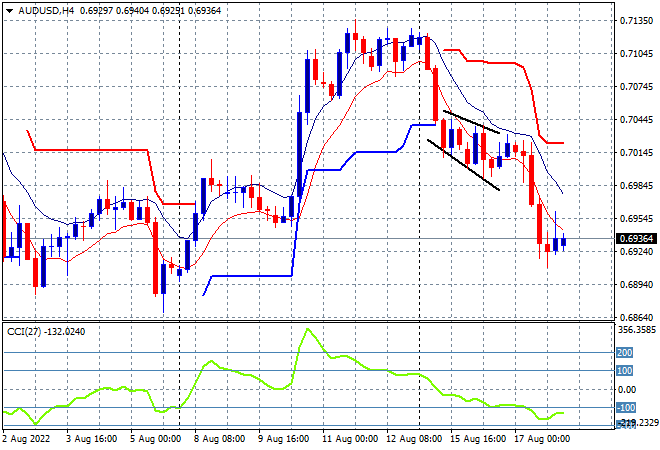
The Australian dollar wasn’t able to hold onto the weakness at the 70 handle with a slump through the low moving average on the four hourly chart and retracing down to the 69.20 level. Price action had never threatened the high moving average and remained below former trailing ATR support with four hourly momentum picking up on the negative side before this slump and could go even lower on today’s unemployment number so watch for any further session lows:
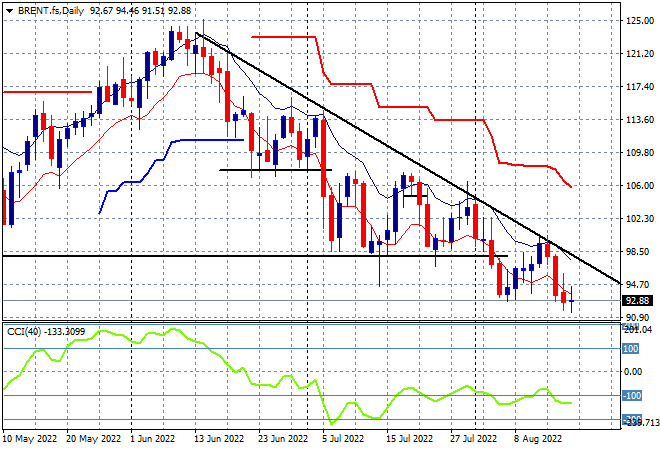
Oil markets continued their deflationary trend with Brent crude having another wide ranging session that ended with a mild loss, closing below the $93USD per barrel level again and almost taking prices below the pre-Russian invasion February lows. This reversal was due to price action still poised around the downtrend line from the June highs with no breakout from daily momentum which has been unable to get out of its very negative funk. The real level to beat remains $100 which is turning into very strong resistance here:
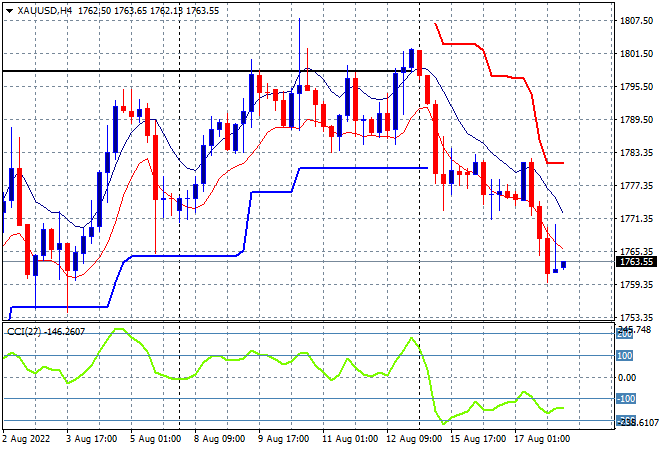
Gold was pushed down even further overnight as price action is still reacting to the false clearance of the $1800USD per ounce level from Friday night with another test of the previous weekly low at the $1763 level for a new daily low. The four hourly chart shows this reversal in obvious fashion with short term momentum remaining oversold for now, so expect another test of the $1750 support level soon:
Glossary of Acronyms and Technical Analysis Terms:
ATR: Average True Range – measures the degree of price volatility averaged over a time period
ATR Support/Resistance: a ratcheting mechanism that follows price below/above a trend, that if breached shows above average volatility
CCI: Commodity Channel Index: a momentum reading that calculates current price away from the statistical mean or “typical” price to indicate overbought (far above the mean) or oversold (far below the mean)
Low/High Moving Average: rolling mean of prices in this case, the low and high for the day/hour which creates a band around the actual price movement
FOMC: Federal Open Market Committee, monthly meeting of Federal Reserve regarding monetary policy (setting interest rates)
DOE: US Department of Energy
Uncle Point: or stop loss point, a level at which you’ve clearly been wrong on your position, so cry uncle and get out!wrong on your position, so cry uncle and get out!