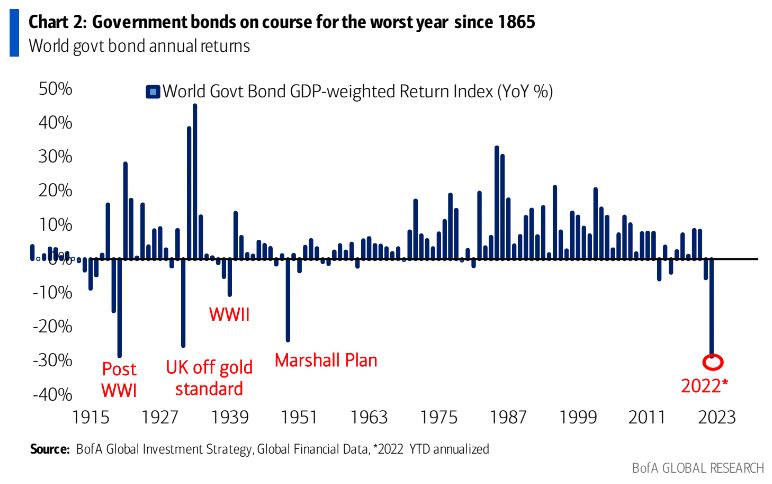
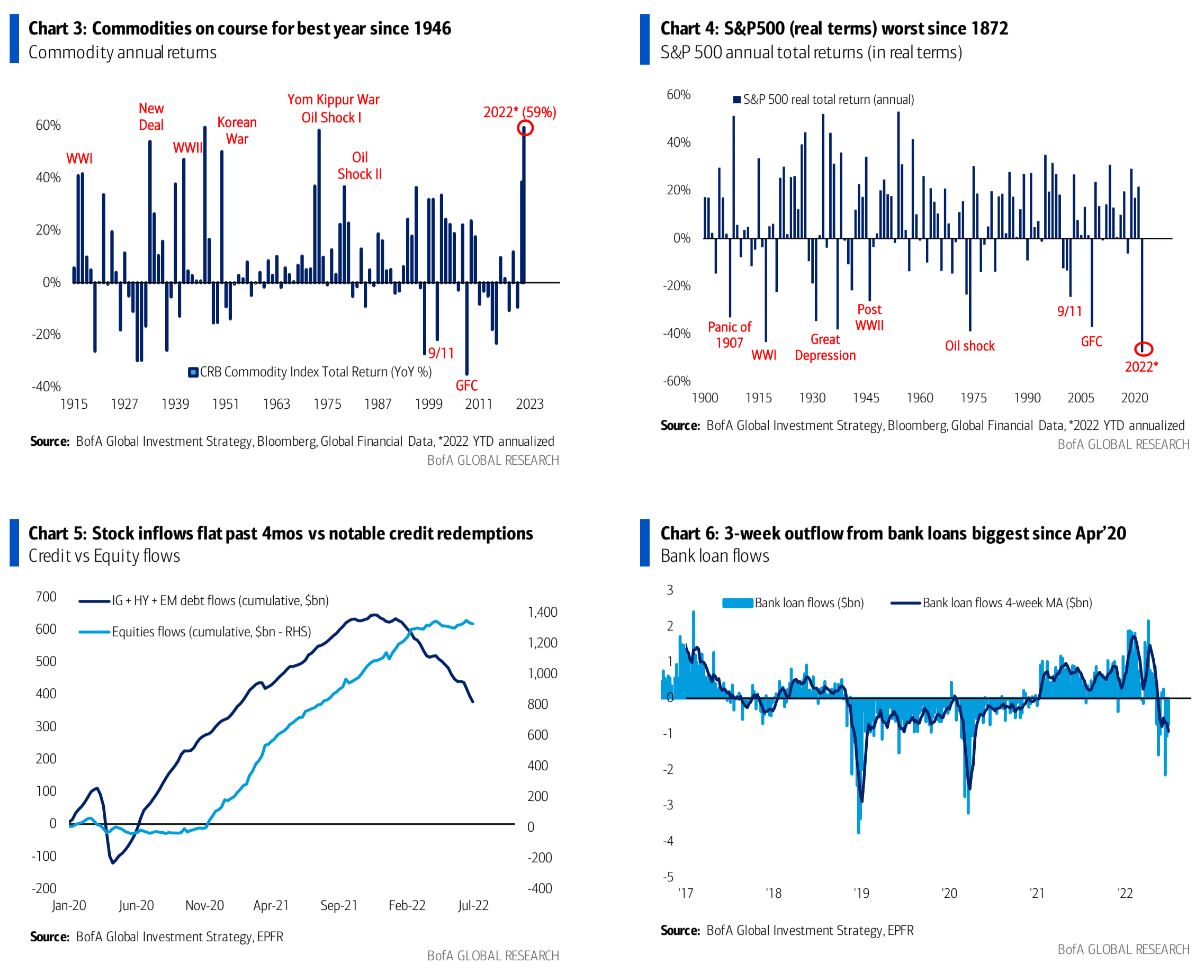
Tale of the Tape: in‘22 commodities on course for best year since 1946(Chart 3), govt bonds worst year since 1865(Chart 2), S&P500 (real terms–Chart 4) worst since 1872.
The Price is Right: in Q2’22 commodity gains moderated (8.4% vs 35.0% in Q1)…”inflation shock”consensus, big gains in US$ (6.9%), big losses govt bonds (-9.5%), massive losses crypto (Bitcoin-58.1%)…”rates shock” begins, accelerated losses in credit (HY-10.9% vs-6.0%) & stocks (-14.6% vs-5.3%)…”recession shock”begins; key asset prices H2 = depth of recession given “credit shock” & geopolitical risks.
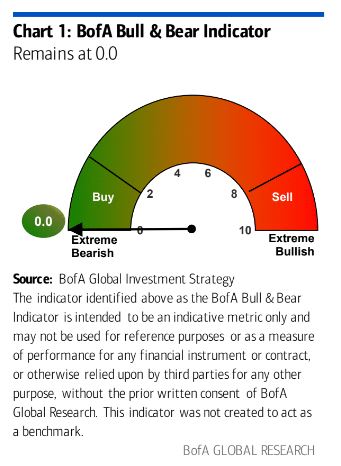
BofA Bull & Bear Indicator: remains at 0 = “max bearish” level for 3rd consecutive week (Chart 1); 3 month returns following “buy” signal strong so long as no 2SD event (e.g. WorldCom Jul’02, Lehman Sep’08, UST downgrade Aug’11, China deval Aug’15–Table1).
BofA Global Breadth Rule: remains at contrarian “buy signal” (I.e. >88% of equity indices trading below 200dma and 50dma).
Weekly Flows:$1.1bn from gold, $5.8bn from equities,$17.0bn from bonds, $18.3bnfrom cash.
The Big Flow to Know: inflows to stocks flat past 4 months, in contrast to notable credit redemptions (Chart5).
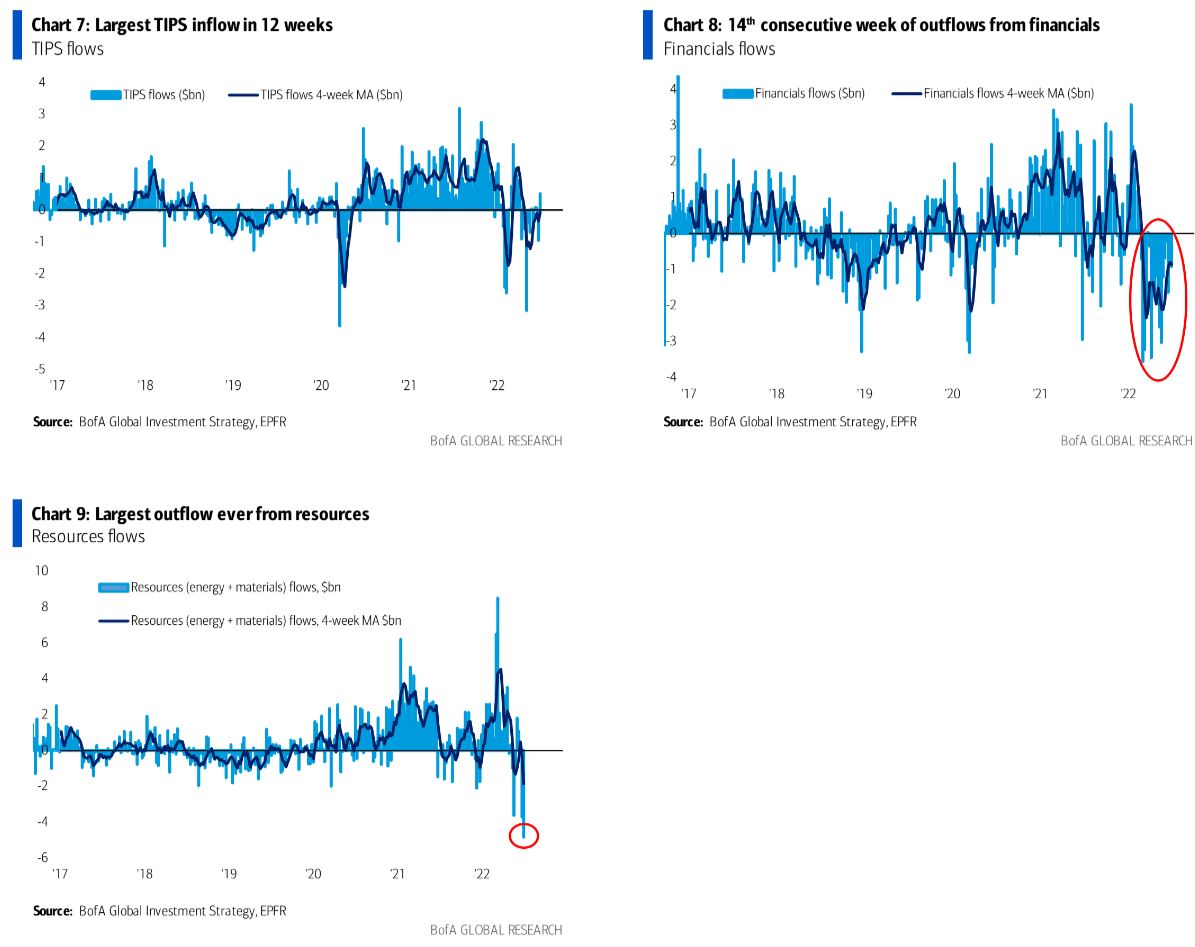
Flows to Know: 3-week outflow from bank loans biggest since Apr’20 ($3.8bn–Chart6)…Fed hike expectations peaking; largest TIPS inflow in 12 weeks ($0.5bn–Chart7)…inflation expectations not peaking; 14th consecutive week of outflows from financials($0.6bn–Chart 8), largest outflow ever from resources (materials & energy–Chart9)…recession odds rising; largest inflow to EM equities in 9 weeks ($1.8bn); largest outflow from European equities since Mar’22 ($5.5bn).
Hartnett has been superb over the past year. But, we should note, that his Bull/Bear indicator is sometimes very early. The Market Ear has more on sentiment:
This (another) GS sentiment index is far from the extreme levels where the old folks will come caning down Wall Street…This GS “Sentiment Indicator” measures stock positioning across retail, institutional, and foreign investors versus the past 12 months. Readings below -1.0 or above +1.0 indicate extreme positions that are significant in predicting future returns.
Below COVID lows for equity long/short, with a recent small uptick….(chart 1). Still a lot of room to fall for “all strategies” where gross & net still at 69%-tile on a 5 year look-back (chart 2).
A chastened Goldman points out some of the whackiest indicators suggesting we’re a long way from equity capitulation:
My biggest risk for 2H is that investors have not seen their 1H half statements and decide to reduce risk.
There have been no unwinds from the largest and most important owner of the market, and I don’t know if that is common knowledge for folks that don’t have Bloomberg IB or watch CNBC. It is time for a thread.
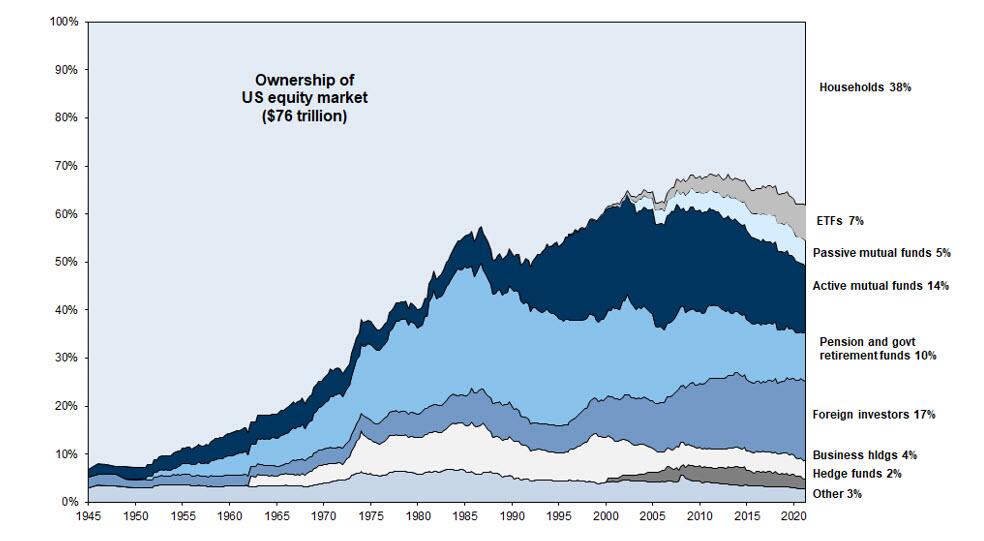
US Households own 38% of the $76 Trillion US Stock Market. US households have more impact on market direction than anyone else.
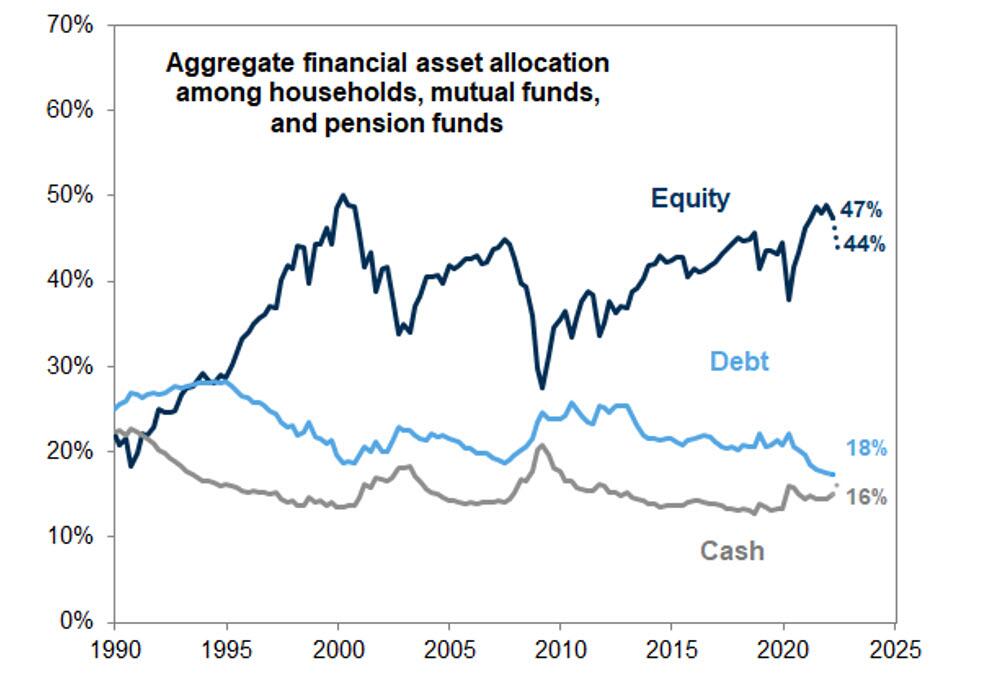
After the second worst start to the 60/40 since 1900, there has been almost NO risk reduction. We show that equity exposure dropped a modest 300bps from 47% percentage points to 44% percentage points.
How can this be? The top 1% own 54% of the equity market and the top 10% own 89% of the market. Can equities be an inflation hedge for the largest percentage of incomes, who have the ability to sustain a drawdown within their own investor portfolios? It’s a thought.
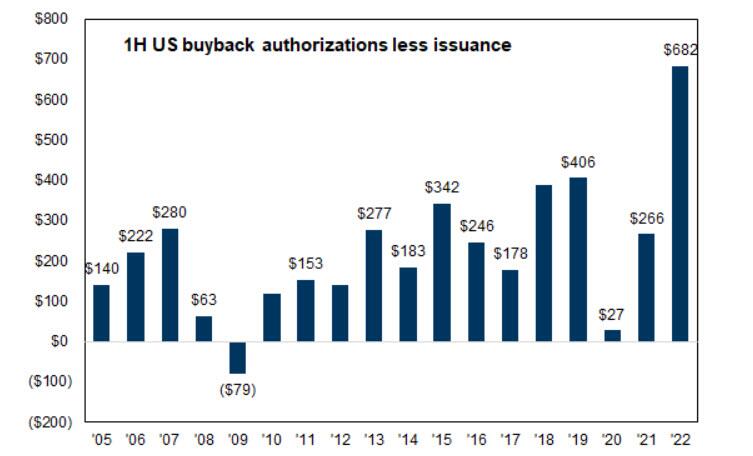
After all of the hoopla, the work from home trader, who started trading during the Covid 2020 era, is now no longer a market force and I can’t even see this impact on my longer term charts. As always, for the last 20 years, I give you my outperformer (US Corporates) and underperformer (Issuance) in the flow-of-funds world for the first half of the year. Any slow down in corporate repurchases in 2H after lower guidance?
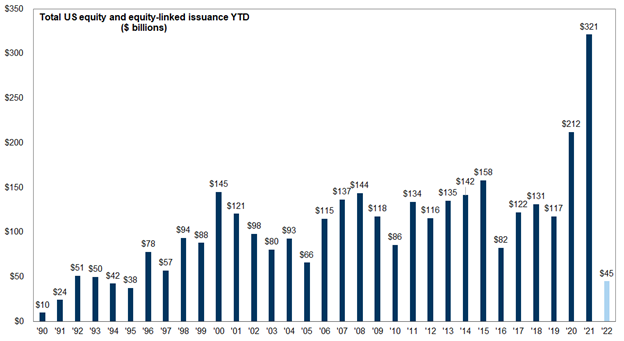
Total US Equity and Equity linked issuance for 1H 22 is $45B, this is the lowest 1H since 1995 ($38B)
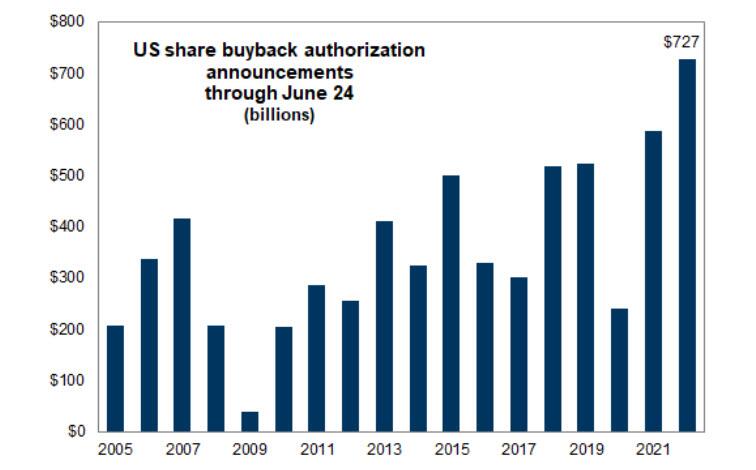
US corporate authorizations for 1H 22 were $727B, the best year on record. This exceeds 1H 21 which was $600B, by +20%.
The Net impact (Buybacks ex-issuance) of $682B is the best on record and is >$276B larger than the prior impact record in 2019.
For comparison purposes following ’08, issuance exceeded buybacks in 2009, and had negative impact.
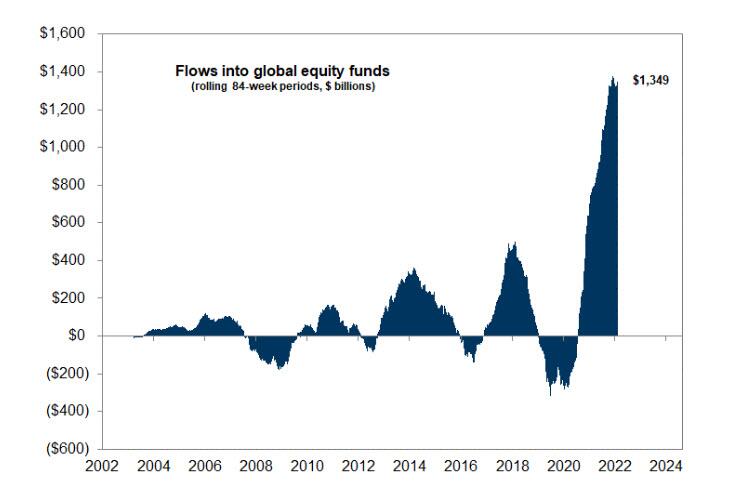
Second place for the largest buyer was “passive equity funds” who have seen >$1.349 Trillion worth of inflows over the past 84 weeks.
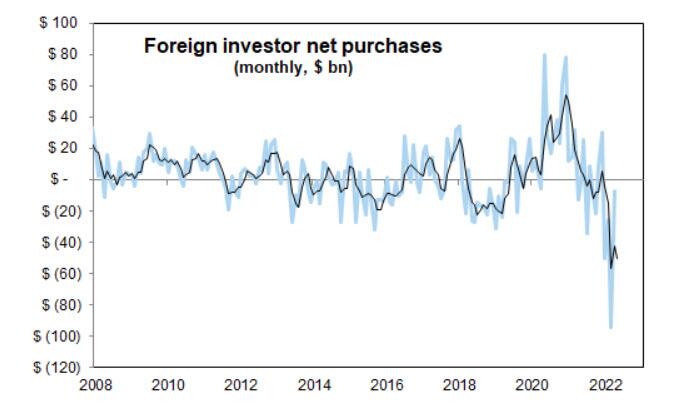
Second place for the largest seller was “foreigner investors” aka Central bankers who no longer want US “tech” stocks as a key allocation. Does this continue? It was heavy going into the end of 1H.
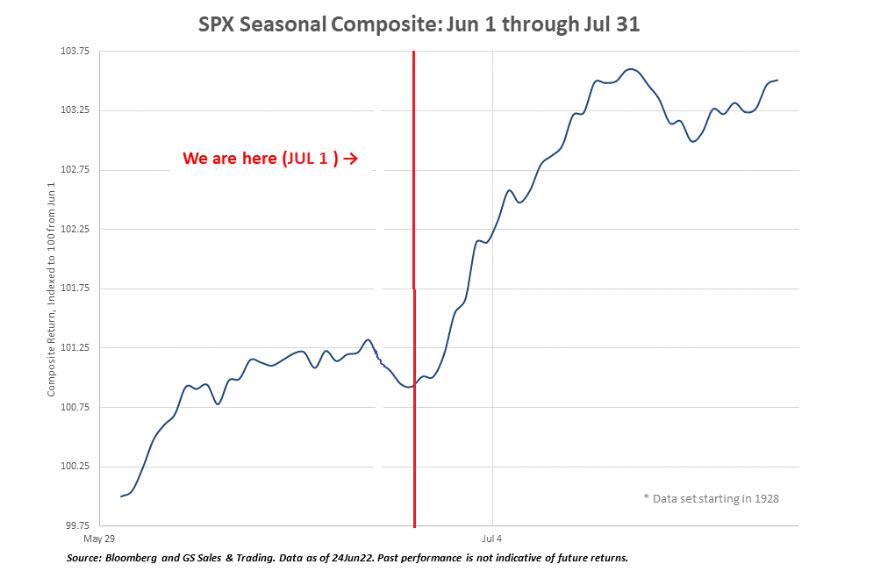
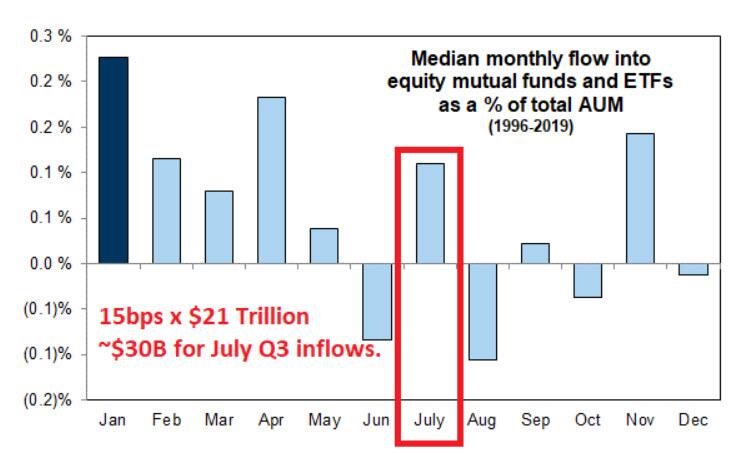
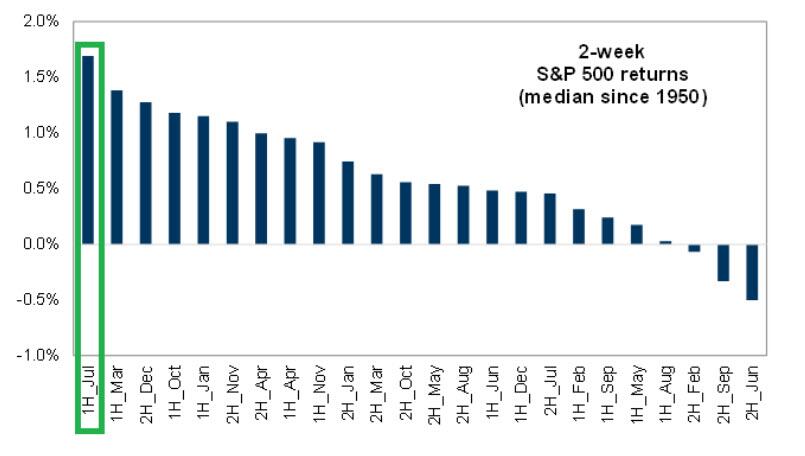
Do we bounce right now? We are here. We are entering the best two week period of the year.
… That’s when money comes in.
… If it doesn’t I am worried about the path. We are looking to fade, “the rally” if it comes later in the month.
1H July is the best period from now until July 17. 2H June was the was worst. We are watching the seasonal, robotic allocation, that happens every quarter. Will keep you posted.
Check out those flows into global equity funds. In every downturn of the last twenty years, let alone recession, they have turned negative before we hit bottom. Today? Holy shit!
Morgan Stanley is also arguing that credit spreads are not wide enough yet, either, which means more pressure on equity:
For some time, our economists have been highlighting that recession risks are rising globally. In their mid-year outlook, they lowered their 2022 global growth forecast sharply to 2.9%Y, less than half the 6.2%Y level a year ago. Since then, deceleration has continued. The combination of updated forecasts for a recession in the euro area, weaker incoming data, and revisions to 1Q GDP has led our US economists to shift down their 2022 US GDP forecast to 0.9% 4Q/4Q, and they have suggested that the risk of a US recession by the end of this year is high. A hallmark of the last three US recessions has been a spike in corporate credit default rates. We would argue that the credit default experience in a potential US recession may be more moderate this time around. However, despite the significant repricing in June, valuation adjustment is still incomplete.
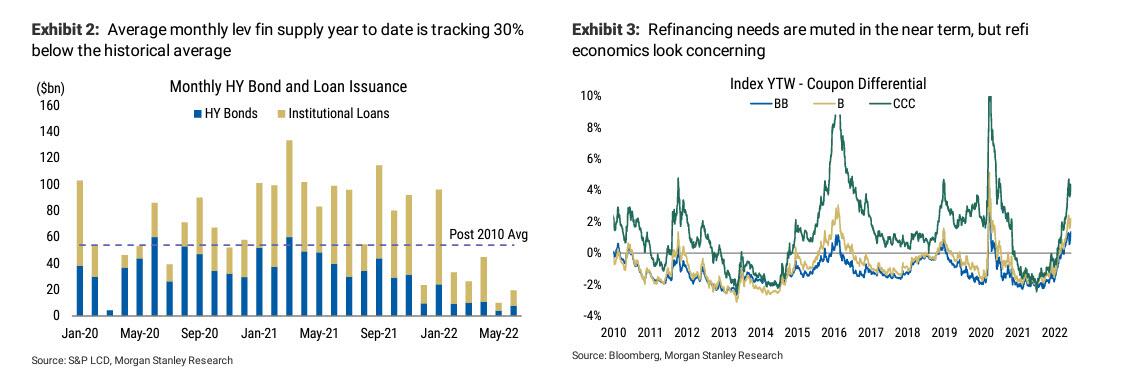
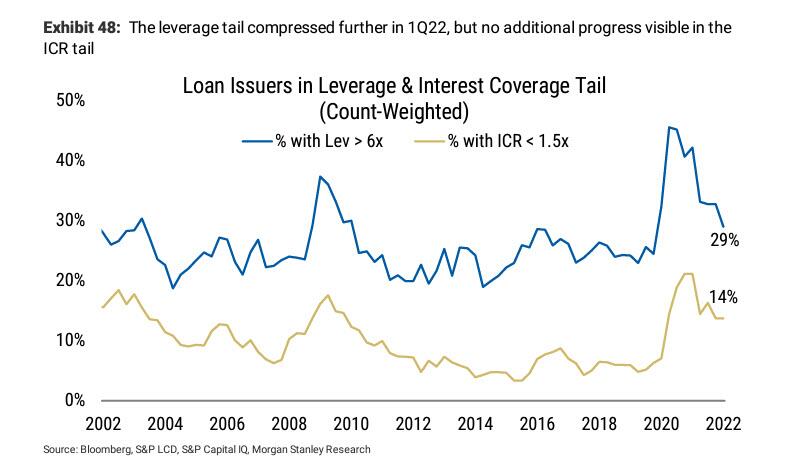
At the onset of the current hiking cycle, credit fundamentals were on a much healthier footing than in other cycles. Despite some deterioration at the margin in the last quarter, fundamentals remain reasonable and in line with pre-Covid levels – low net leverage, high interest coverage, and still-healthy cash on balance sheet. The ratings mix of the high yield bond market has improved. Currently, over half of the benchmark HY bond index is BB rated, versus 43% in 2018-19 and 40% in the aftermath of the GFC. Furthermore, refinancing needs are low. During 2022-24, only about 10% of the US$3 trillion in leveraged finance debt (high yield bonds and leveraged loans combined) is due to mature.
We expect higher risk premiums in credit but do not anticipate a spike in corporate defaults over the next 12 months. Our credit strategists, led by Srikanth Sankaran, forecast HY default rates to track 2-2.5% on the Moody’s count-weighted measure through 2Q23 – double the current levels but well inside prior recession peaks. While this would be a notable departure from the experience of the last three recessions, it is not without precedent. In the 1970s and 1980s, we had recessions but without a spike in corporate default rates. No doubt stresses could increase over the medium term, but the more imminent concern is downgrades.
Leveraged loans are the segment of the credit markets most vulnerable to higher rates, given their floating-rate nature. Over the course of past few years, we have seen the loan market drift towards the lower-quality segments (B3/B- ratings). Moody’s estimates that if rates were to increase by 300bp, absent meaningful earnings growth, as many as half of the B3 rated companies would see their interest coverage fall below 1.0x – a level more typical of a Caa rating than B3. Not surprisingly, the downgrade potential is much greater for companies that depend on leveraged loans (floating-rate liabilities) rather than the fixed-rate high yield bonds for funding. Thus we expect downgrades, particularly in the loan market, to be a bigger and more immediate concern for credit markets over the next 12 months rather than spiking defaults.
Until about a month ago, we could argue that credit markets in general, and leveraged credit in particular, were underpricing recession risks. After the sell-off in June, US HY spreads are ~150bp wider, loan prices are down 2.5 points, CCC spreads have breached 1,000bp, and stressed tails have doubled. Clearly, growth risks are starting to be priced, but we think that the credit markets need to calibrate the risk of a recession more fully. For context, IG and HY spreads are at 155bp and 569bp, respectively, while garden-variety recessions/growth scares tend to see spreads go north of 200bp and 750bp, respectively. Thus, more repricing is needed since spreads are still shy of historical levels heading into a recession, especially in the lower-quality segments of the market. Unlike some previous credit cycles (such as the energy sector downturn in 2015-16), we don’t have a ‘problem sector’ per se. As such, identifying defensive sectors and flagging sectors to stay away from is more complicated this time around. Companies with a heavy reliance on low-end consumer demand, elevated wage intensity, and commodity/logistics input costs remain vulnerable in this regard.
As the market recalibrates growth and liquidity risks, we expect decompression and dispersion themes to re-emerge. We would fade any rally in credit markets and recommend investors move up in quality/improve the liquidity profile of their portfolios.
For me, the key is still oil. Until it breaks down, I can’t see how the Fed can seriously consider backing off and the call still hangs over stocks.
MB fund remains very underweight equities, accumulating bonds as they sell, and very long cash tilted to the USD.
David Llewellyn-Smith is Chief Strategist at the MB Fund and MB Super. David is the founding publisher and editor of MacroBusiness and was the founding publisher and global economy editor of The Diplomat, the Asia Pacific’s leading geo-politics and economics portal.
He is also a former gold trader and economic commentator at The Sydney Morning Herald, The Age, the ABC and Business Spectator. He is the co-author of The Great Crash of 2008 with Ross Garnaut and was the editor of the second Garnaut Climate Change Review.

Flow Show
Goldman
Goldman
Flow Show
Barclays
Barclays
Goldman
JPM PB
JPM
Goldman