
Economist Cameron Murray has updated his favourite housing market metric – the Speculative Index – which measures the mortgage interest rate divided by gross yield.
The next chart plots “the Speculative Index across the Australian market as a whole for two choices of interest rates; standard and discounted variable”:
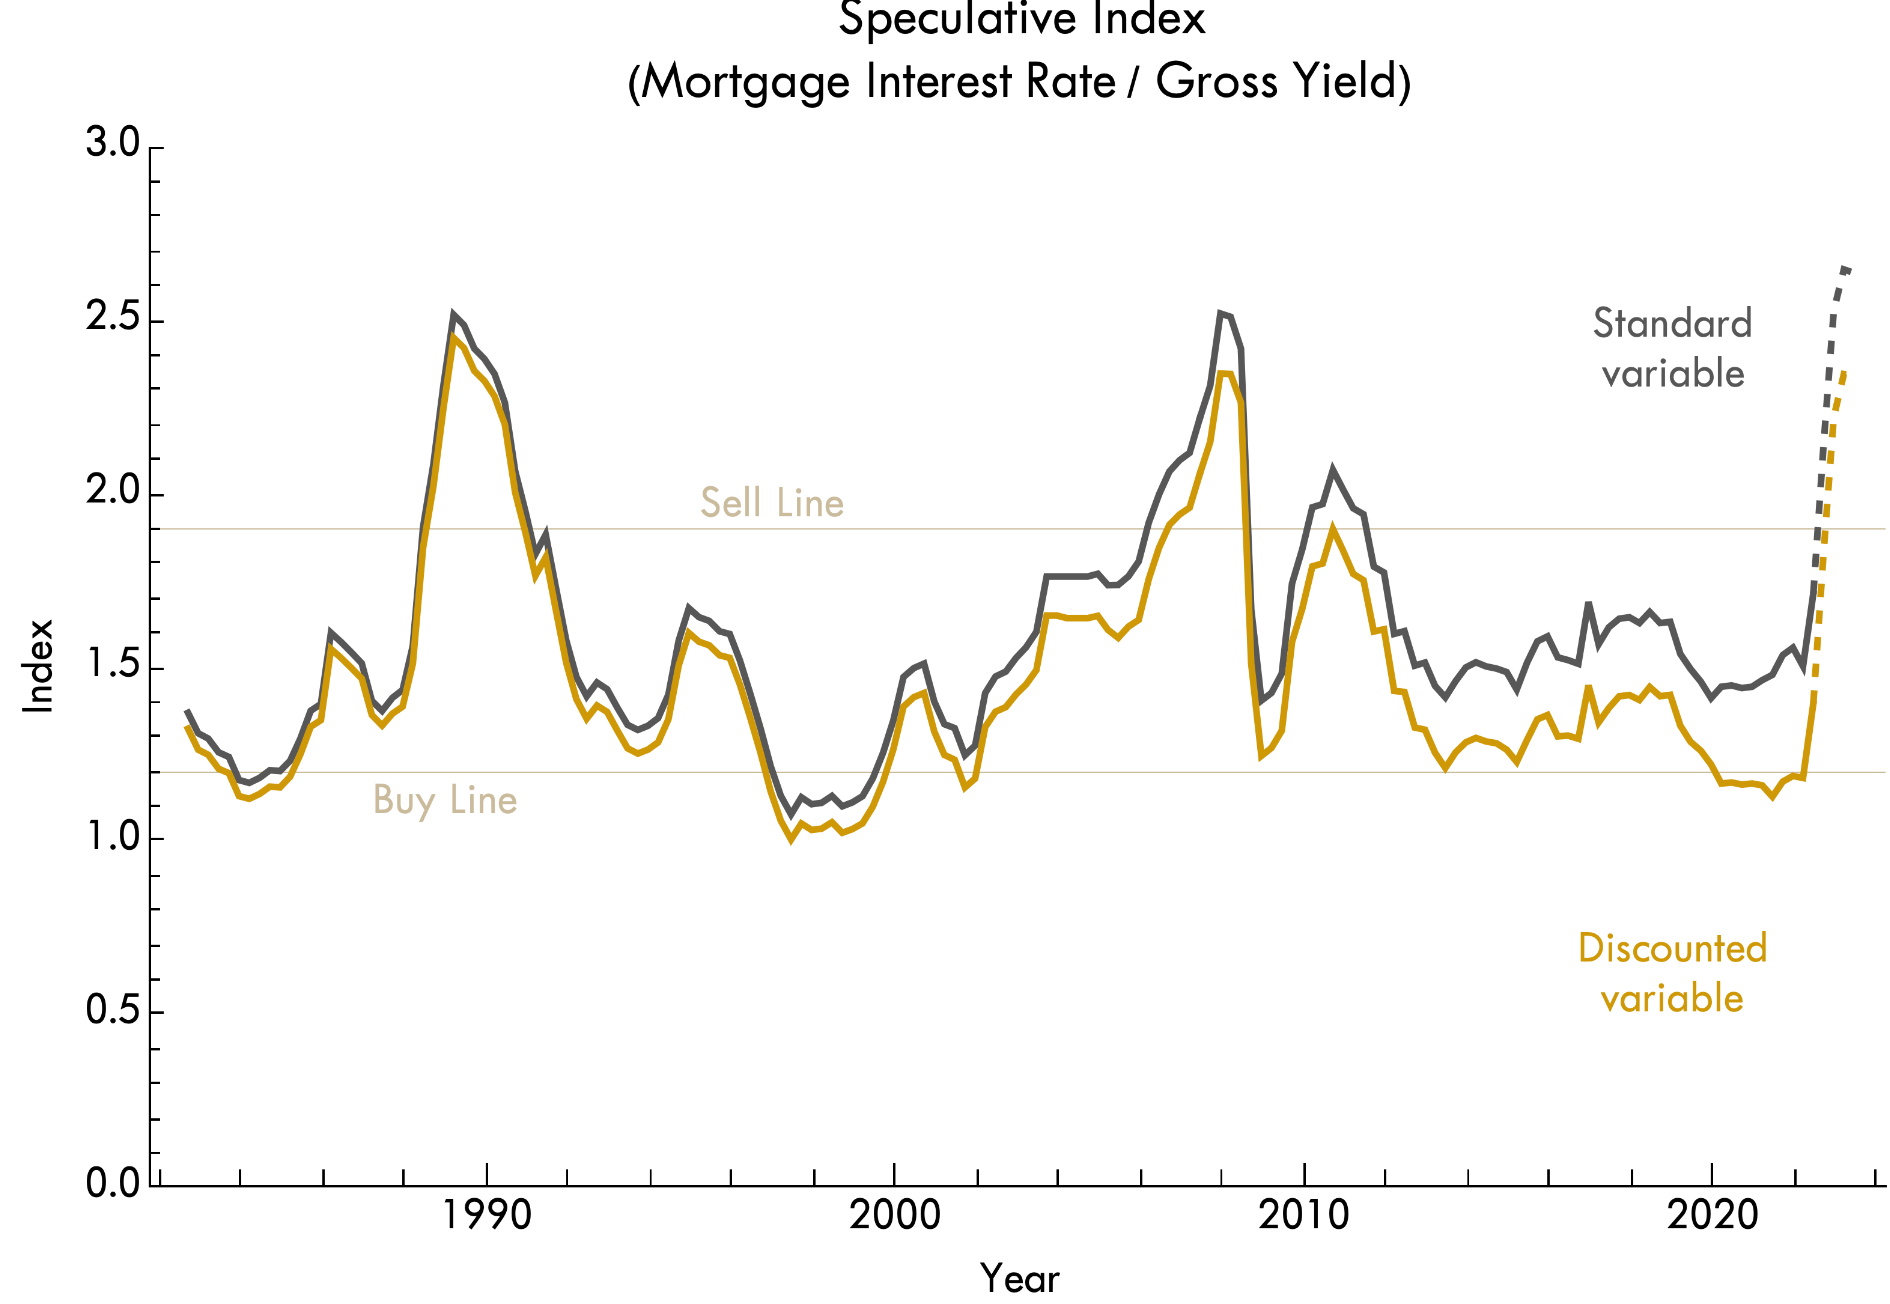
According to Dr Murray:
- The index moves within a limited range, from about 1 to about 2.5. That is, mortgage interest rates never exceed 2.5 times the gross yield of housing and never fall below the yield.
- If you buy housing when the Speculative Index is closer to 1 rather than 2, you usually make much more money than the reverse. So I have marked a Buy Line and Sell Line as a guide of what sort of investment strategy this metric suggests.
- If the expected cash rate rises over the next year are passed on to mortgage interest rates, that pushes the index way up to its limit (dashed lines are a forecast based on that assumption). That is, mortgage rates will be about 2.5 times the gross rental yield of housing by the end of 2022.
- Because the index was near its all-time-lows in 2020, I predicted that property prices were much more likely to rise than fall, even with the COVID shock. At the time, fixed interest rates were also much lower than the standard rate, though this has now reversed.
- That the index moves in cycles shows that adjustments to interest rates take time. They aren’t anticipated. If markets did adjust prices quickly in response to interest rates, this index would be a flat line. Markets do adjust to interest rates. But slowly and cyclically.
- Different cities have slightly different market cycles. The above chart shows the national average. It is possible that some cities, where gross rental yields are still quite high, will boom for a while yet, like Brisbane and Perth. It is also possible that cities like Sydney and Melbourne have flat or falling prices at the same time. This happened in the 2003-06 period when Sydney prices fell 10% and didn’t recover until after the financial crisis.
- What this means is that although one possibility is that house prices fall uniformly as interest rates rise, this is not the norm. One possible outcome is that prices in low-yield cities like Sydney and Melbourne fall 10-15% range, but other higher-yield cities see price rises for another year, with smaller overall falls.
Dr Murray’s Speculative Index helps to explain why house price cycles tend to be most volatile in Sydney, followed by Melbourne. Sydney has the lowest rental yield in the nation, followed by Melbourne:
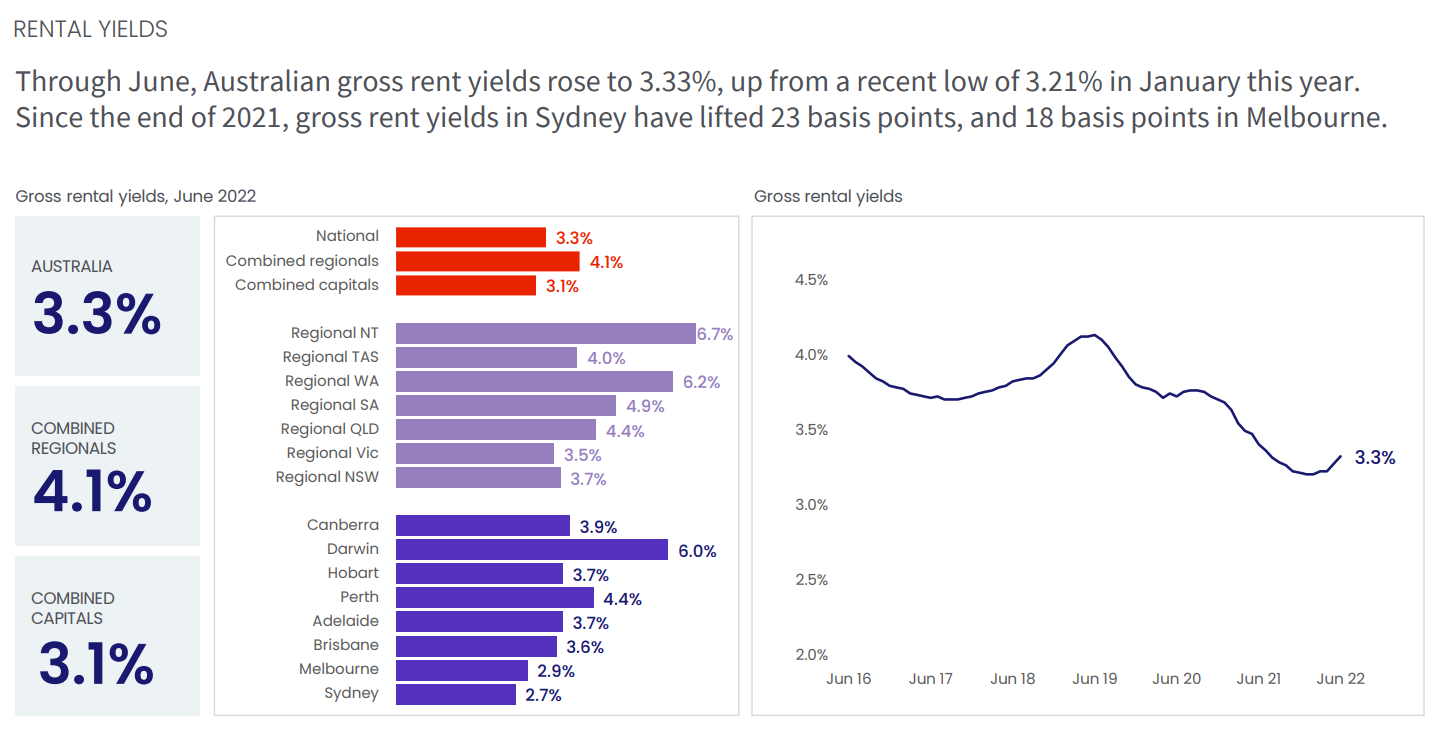
Basically, because Sydney and Melbourne are the nation’s most expensive housing markets – both relative to incomes and rents – they are also the most sensitive to movements in interest rates.
Therefore, when interest rates are cut, Sydney house prices tend to experience bigger price booms, but also bigger price busts when rates rise. This is illustrated clearly in CoreLogic’s dwelling values index, which shows that Sydney has experienced the highest price volatility over the past decade:
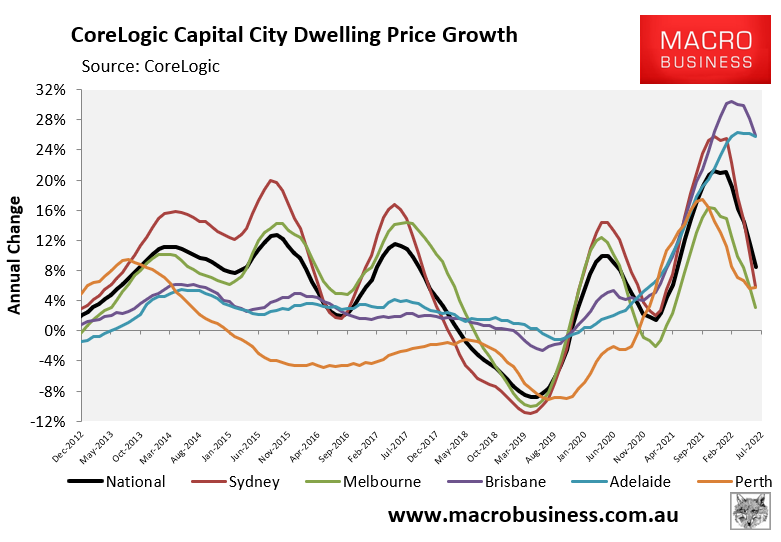
Sydney’s housing market is one giant volatility machine that swings up and down with the credit cycle.
