
Risk sentiment soured with more downside volatility returning to equity markets overnight, not helped by a falling US consumer confidence print that doubled down with more Fed officials wanting big rate rises by the end of the year. Wall Street saw falls of 2-3% which are likely to be repeated in Asia today. The USD returned to strength against everything, with Euro put in its place while the Australian dollar was knocked back down to the 69 handle. Bond markets saw some roundtripping in yields, with 10 year Treasuries hovering around the 3.2% level while interest rate futures lifted slightly to indicate 195 bps in rate rises by the Fed this year. Commodity prices were largely positive, with oil prices lifting more than 2%, although gold fell like the other undollars, heading back down to the $1800USD per ounce level.
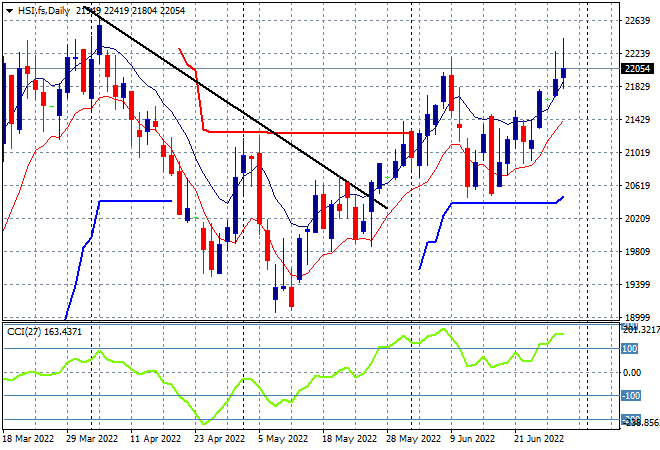
Looking at share markets in Asia from yesterday’s session, where mainland Chinese share markets again pushed higher into the close with the Shanghai Composite finishing nearly 0.9% higher to close back above the 3400 point level while the Hang Seng Index had a similar move, up 0.8% gain to close at 22417 points. The daily chart is showing an attempt to breakout above the previous highs at the 22000 point level but I remain concerned with the overhead tails on these candles that matches the previous false breakout top. Nonetheless, momentum is nicely overbought and we’re seeing higher lows for now:
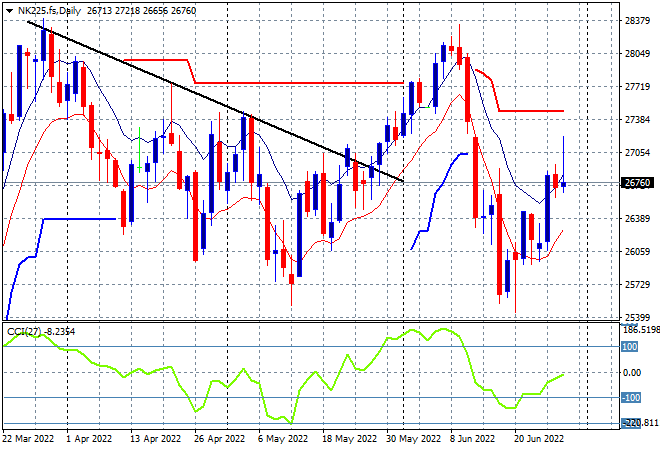
Japanese stock markets also did well, with the Nikkei 225 index closing 0.6% higher at 27049 points. Unfortunately overnight action on Wall Street is seeing risk sentiment sour here with the daily futures chart showing a retracement of those gains with price action back down to but not yet below the high moving average. Daily momentum is still marginally negative but now out of the oversold zone but this requires a proper follow through above the high moving average to confirm a bottom:
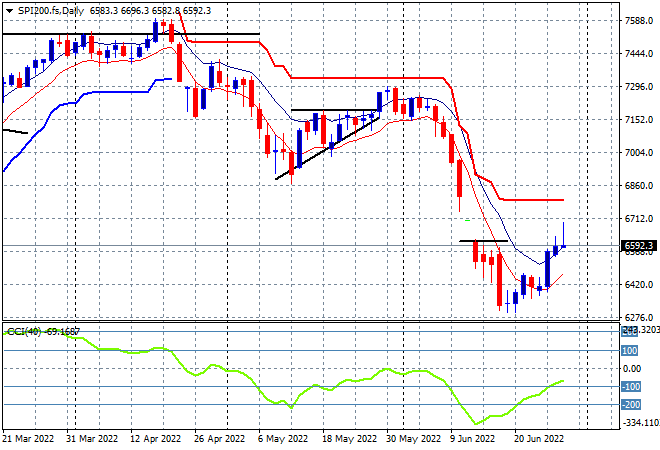
Australian stocks put in some outsized gains with the ASX200 finishing more than 0.8% higher, closing at 6763 points. SPI futures however are set to take this all back and then some, currently down more than 1.2% given the sharp pullback on Wall Street. The daily chart is still not a pretty picture with my contention of price needing to recover well above the 6600 point level before calling any bottoming action still holding, as daily momentum reverts away from the very oversold zone but is still quite negative:
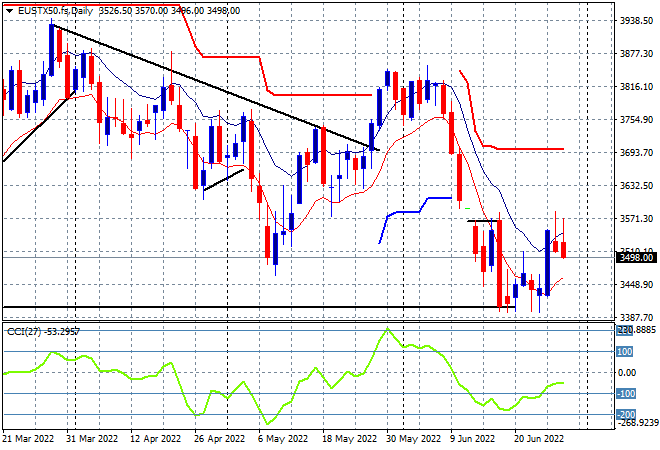
European stocks had a good start to the session but failed to gain momentum with Wall Street pushing down risk sentiment as the Eurostoxx 50 index eventually closed 0.3% higher at 3549 points, with a proper retracement in post close futures. The daily chart picture remains in somewhat of a bearish states here with price action still around the the March dip lows as this classic swing action looks to finish before it even starts as daily momentum remains negative. As I’ve said for awhile now, price needs to get back well above the 3570 point area that was resistance for the last couple of weeks:
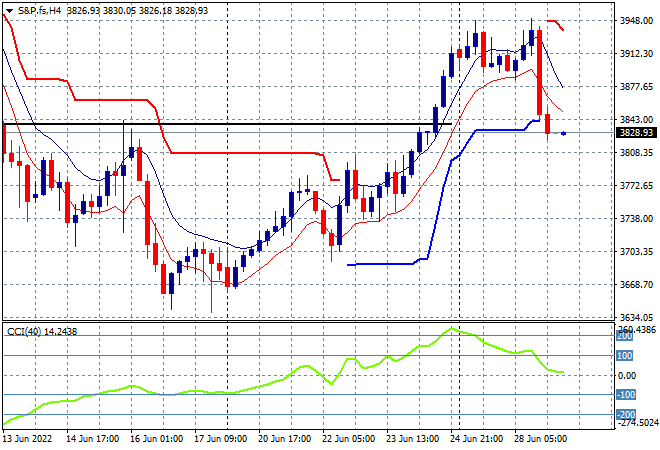
Wall Street built on their start of week pullbacks with more selling this time, as the NASDAQ lost nearly 3% while the S&P500 closed down 2% to finish at 3821 points. The four hourly chart shows a similar picture to European stocks, with the nascent signs building of a bottom forming below the March lows still requiring a strong fill above that lower horizontal black line which has now been fully retraced. A proper recovery out of this correction requires a rally back through the psychologically important 4000 point zone, which is seemingly out of reach:
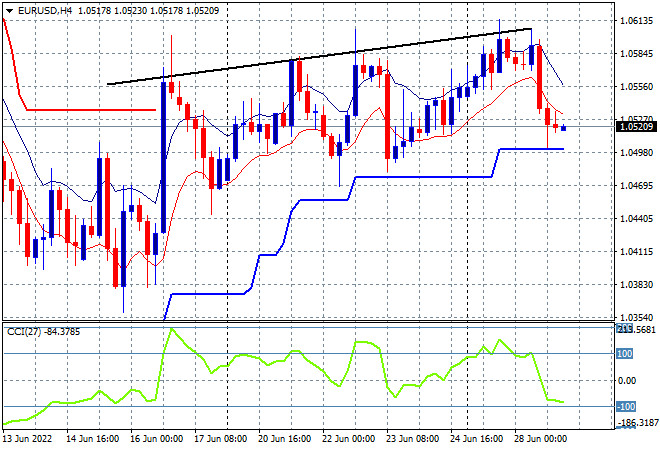
Currency markets were no longer contained again, with the USD surging on the back of some Fed comments, with Euro the main casualty as it pushed back down to the 1.05 handle. The four hourly chart was showing a bullish bias to this overall sideways move as short term momentum picks up but price action is now back down to trailing ATR resistance with momentum switching to nearly oversold conditions. As I said yesterday, I’d watch trailing ATR support at the 1.05 level here carefully for a proper rollover:
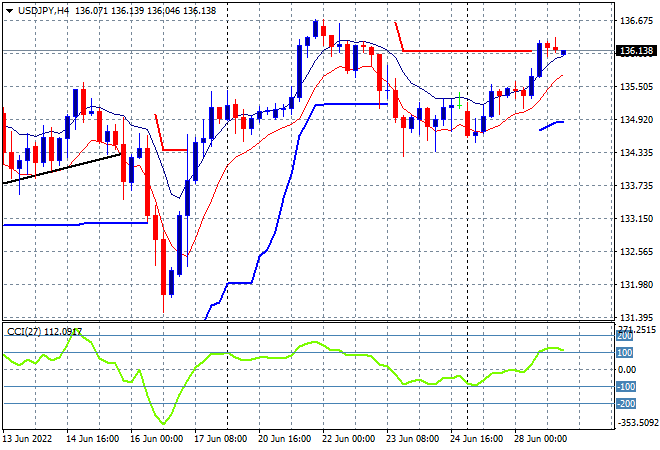
The USDJPY pair was able to continue its liftoff after being down for the count on Friday night, now above the 136 handle but not quite matching last weeks intrasession high. This confirms the uncle point at the 134 handle with four hourly momentum suggesting another attempt to make a new high soon, if price can stay above the high moving average:
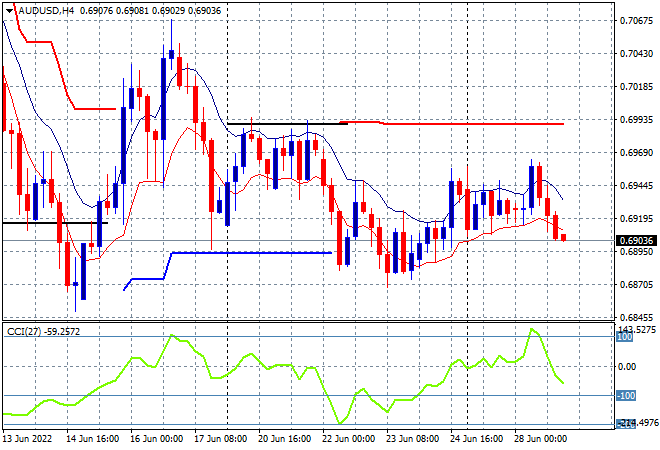
The Australian dollar has been put back in its place as it fails to get back above the 70 handle, with sellers wanting to get it back down to the previous weekly low at the mid 68 level. My contention of a further retracement below the 69 handle still holds as the Fed well remains ahead of the hapless boffins at Martin Place, with four hourly momentum now switching to negative as this swing play runs out of puff, watch for a go at the 68.70 level next:
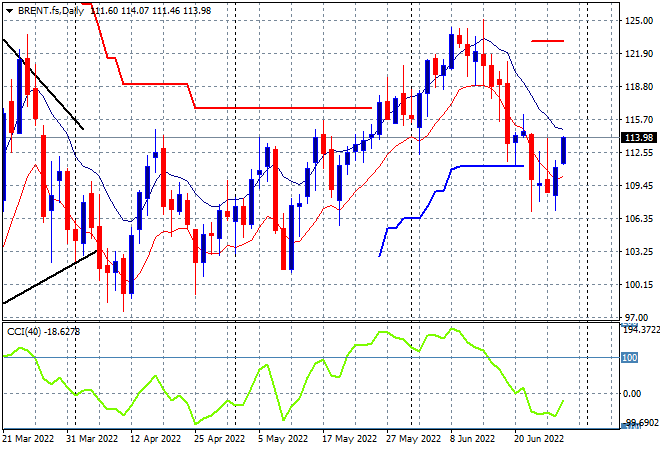
Oil markets are trying to stabilise after a series of lower lows that saw Brent crude pushed well below the $108USD per barrel level last week with another rally overnight taking it back above the $113 level. Daily momentum is still negative however, with price support moving back down to the $106 level now. If this move fails to gain traction above the high moving average and the $115 area, it could turn into a push down to the $100 psychological support level next:
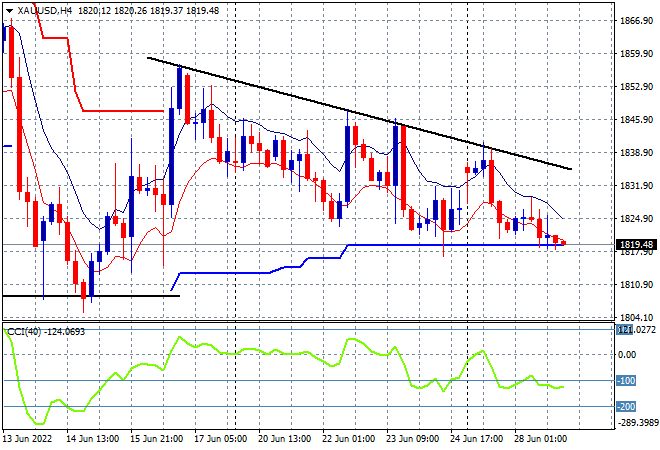
Gold still can’t get out of its sideways bearish oscillation with another down session seeing it pushed below the $1820USD per ounce level as resistance firms quite strongly overhead at the $1850USD per ounce level. Daily momentum remains negative as four hourly momentum rolls back into the oversold zone, with the short term trend showing a series of lower low sessions, so watch for a breakdown shortly:
Glossary of Acronyms and Technical Analysis Terms:
ATR: Average True Range – measures the degree of price volatility averaged over a time period
ATR Support/Resistance: a ratcheting mechanism that follows price below/above a trend, that if breached shows above average volatility
CCI: Commodity Channel Index: a momentum reading that calculates current price away from the statistical mean or “typical” price to indicate overbought (far above the mean) or oversold (far below the mean)
Low/High Moving Average: rolling mean of prices in this case, the low and high for the day/hour which creates a band around the actual price movement
FOMC: Federal Open Market Committee, monthly meeting of Federal Reserve regarding monetary policy (setting interest rates)
DOE: US Department of Energy
Uncle Point: or stop loss point, a level at which you’ve clearly been wrong on your position, so cry uncle and get out!wrong on your position, so cry uncle and get out!