
Friday night saw volatility remain across both sides of the Atlantic, but it was all intrasession instead of more downside, with some stability in the bond market helping. In currency land, the USD pushed back against the undollars with Euro and the Australian dollar losing significant ground they had gained through the week. Bond markets saw range trading, with 10 year Treasuries oscillating between the 3.2 and 3.3% level with interest rate futures still firming up to another 200 bps in rate rises by the Fed this year. Commodity prices saw some bigger falls than expected, with oil prices losing more than 4%, with Brent crude down to the $113USD per barrel level, while gold fell 1% to retrace below the $1850USD per ounce level again.
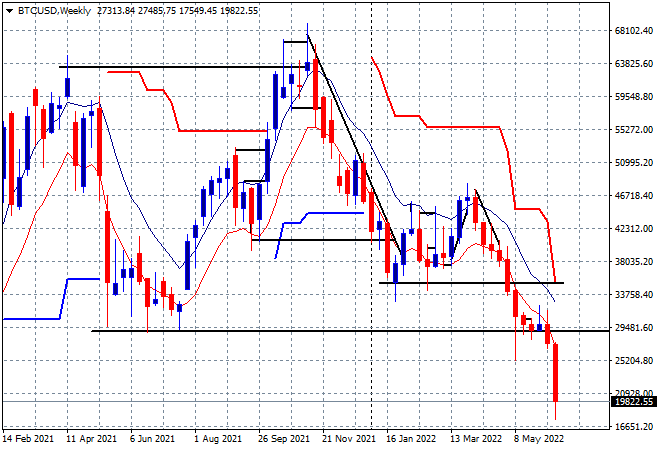
Bitcoin is toast:
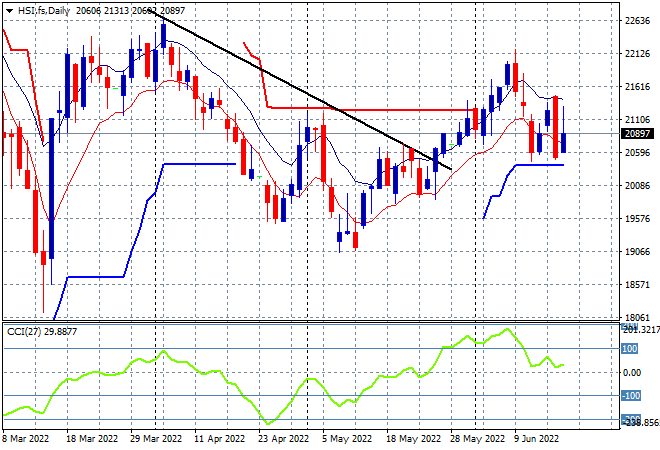
Looking at share markets in Asia from yesterday’s session, where Chinese share markets remain volatile with the Shanghai Composite closing up 1% to 3316 points while the Hang Seng Index bounced back in similar fashion, up more than 1% to 21075 points. Despite this bounce, the daily chart is showing price still getting pushed right down to trailing daily ATR support at the 20500 point level with daily momentum barely positive. Its still a fair way from the May lows at the 19000 point level, but watch for any break below the 20000 point level here very closely:
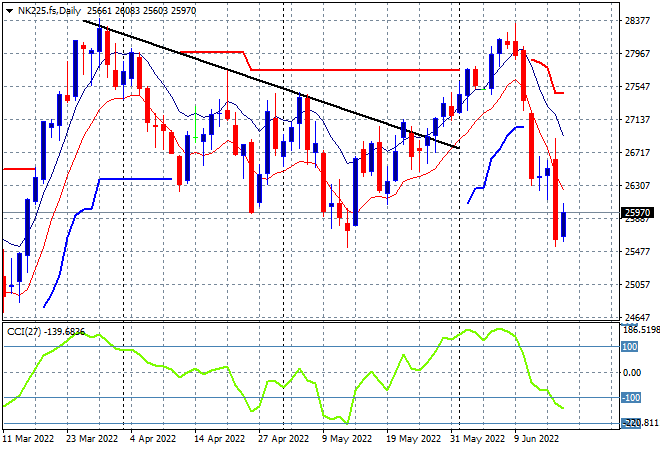
Japanese stock markets did not like the neutral BOJ stance with the Nikkei 225 index closing some 1.7% lower at 25963 points. The daily futures chart of the Nikkei 225 however is showing a more modest start to the trading week given the “stability” on Wall Street on Friday night, but daily momentum is now well into the oversold zone to possibly wipe out the May lows at the 25500 point area:
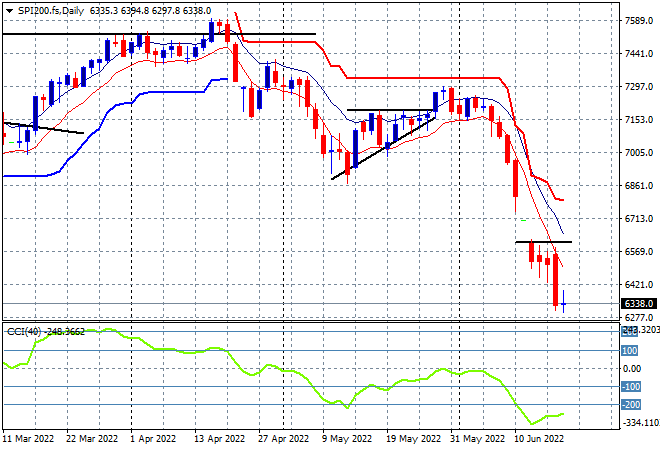
Australian stocks did not do well in their final session of the week with the ASX200 finishing nearly 2% lower, closing at 6474 points. SPI futures are still falling, but only by 20 points or so, with the indication of starting the trading week at the 6400 point area. The daily charts continue to show that price is in near freefall that needs to recover well above the 6600 point level before calling any bottoming action as daily momentum is in the very oversold zone:
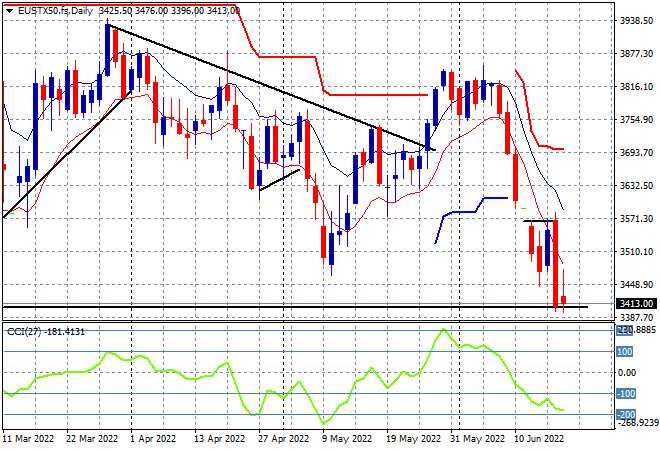
European stocks are still quite mixed with varied returns across and outside the continent, with the ramifications of the BOE and Swiss bank rate hikes still smarting. The Eurostoxx 50 index eventually closing 0.3% higher to finish at 3438 points, but its nothing to write home about. The daily chart picture remains bearish at best as price hovers right on the previous daily/weekly lows from the March dip. Daily momentum remains in quite an oversold position with price needing to get back above the 3570 point area very quickly or it will roll over here:
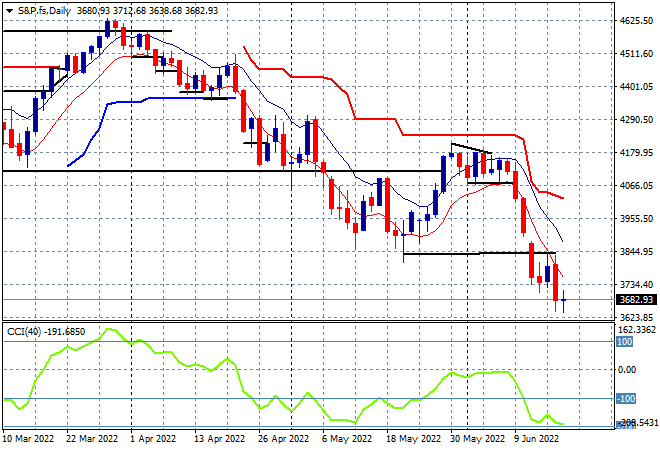
Wall Street remains in a volatile phase as well, with the headline Dow losing ground while tech stocks on the NASDAQ put in a relatively meagre bounce, up 1.4% while the S&P500 put on just 0.2% to finish the week at 3674 points. The daily chart is also similar to European bourses, but with more hesitation building as the March lows remaining quite broken. To recover out of this correction requires a rally that must go through the 3845 point area, the lows from last week and then back up through the psychologically important 4000 point zone:
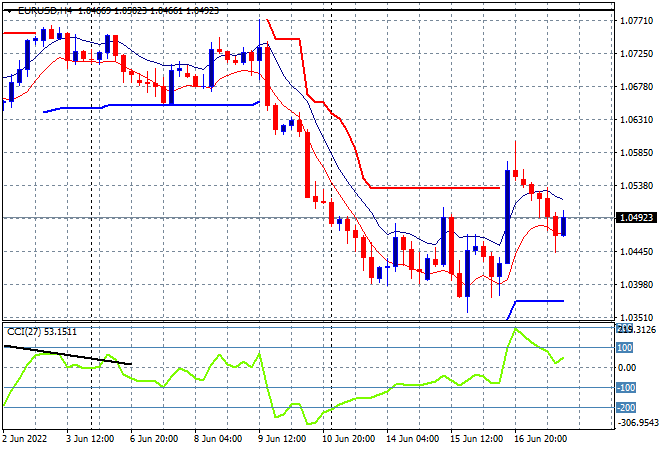
Currency markets pulled back a little in volatility but USD fought back following the only temporary setback post the BOE/SNB rate rises with Euro smacked back down below the 1.05 handle after its big surge mid-week. While traders might be anticipating more ECB rate rises on the back of the BOE/SNB rises, as I said last week this repricing maybe temporary given the 75bps scheduled by the Fed next month, so watch for any retracement below former trailing ATR resistance here:
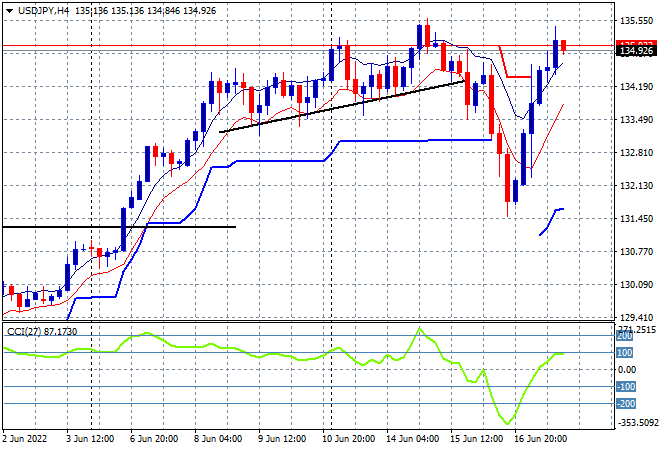
The USDJPY pair has bounced back strongly and was indicating as much as opposed to the other undollars getting ahead of themselves post the BOE raise. Price has come back almost to the previous highs near the 135 area, with short term momentum sharply inverting almost back to overbought levels as this dip is filled quickly. This sort of volatility is great for currency traders but does not give a good indication of trend with the potential for a rollover actually building again here:
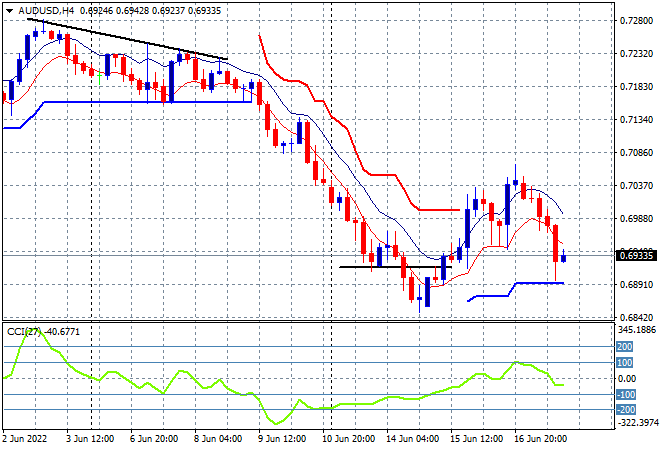
The Australian dollar rolled over like a dead dog, as expected, with its bounce back above the 70 handle running out of puff, pushing it back down to just above the 69.30 area. The RBA is well behind the Fed here and I still contend the USD will continue to crush the Pacific Peso. This short term move higher was not unexpected, but was going against the grain with momentum never overbought, so watch for a retracement below the 69 handle next:
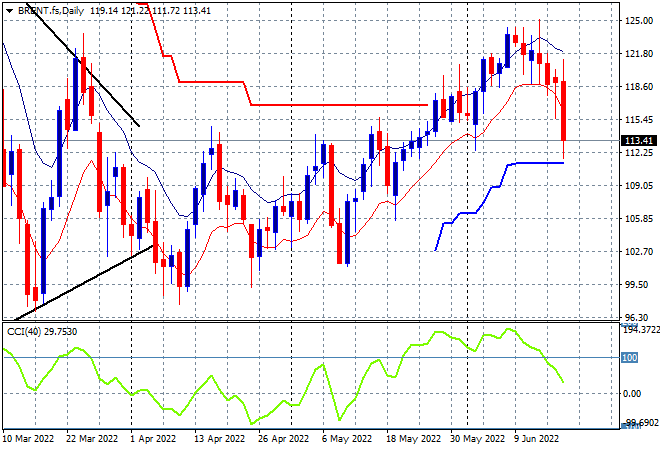
Oil markets had been building in downside volatility all week but were able to fill the gaps by the end of the session, but failed on Friday night with a quick move down by over 4%, with Brent crude finishing at the $113USD per barrel level. Daily momentum has retraced from its overbought status but price is no longer supported at the $115 area and is now below the previous ATR trailing resistance level as well. The next area to watch is trailing daily ATR support at the $110 level:
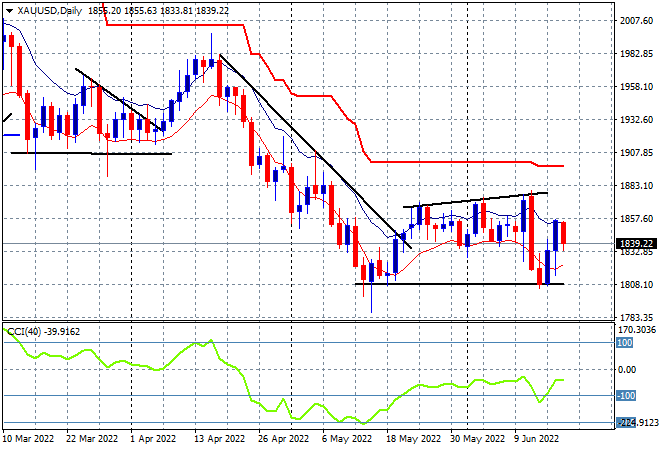
Gold can’t get out of its sideways bearish move with another consolidation on Friday night to knock it back below the $1840USD per ounce level. Notably, daily momentum remains negative and while the bounce off the $1800USD per ounce level is a good sign of a bottom forming, its not yet enough to convince more buyers to step in:
Glossary of Acronyms and Technical Analysis Terms:
ATR: Average True Range – measures the degree of price volatility averaged over a time period
ATR Support/Resistance: a ratcheting mechanism that follows price below/above a trend, that if breached shows above average volatility
CCI: Commodity Channel Index: a momentum reading that calculates current price away from the statistical mean or “typical” price to indicate overbought (far above the mean) or oversold (far below the mean)
Low/High Moving Average: rolling mean of prices in this case, the low and high for the day/hour which creates a band around the actual price movement
FOMC: Federal Open Market Committee, monthly meeting of Federal Reserve regarding monetary policy (setting interest rates)
DOE: US Department of Energy
Uncle Point: or stop loss point, a level at which you’ve clearly been wrong on your position, so cry uncle and get out!wrong on your position, so cry uncle and get out!