
Two more central banks joined the rate rise party last night with the BOE then joined by an unexpected Swiss central bank, with European shocks already shaken falling over and then Wall Street joining in with 3-4% single session losses. In currency land, the USD pulled back again from its 20 year high, with the Aussie and Kiwi making strong gains, as Euro also woke up from its slumber. Bond markets saw a retreat in yields, with 10 year Treasuries pulling back to the 3.25% level with interest rate futures still suggesting another 200 bps in rate rises by the end of the year. Commodity prices were mixed across the whole complex, with oil prices retracing back to key support levels before bouncing back up, with Brent crude recovering to the $119USD per barrel level, while gold lifted nearly 2% after continuing its bounce off the $1800USD per ounce level.
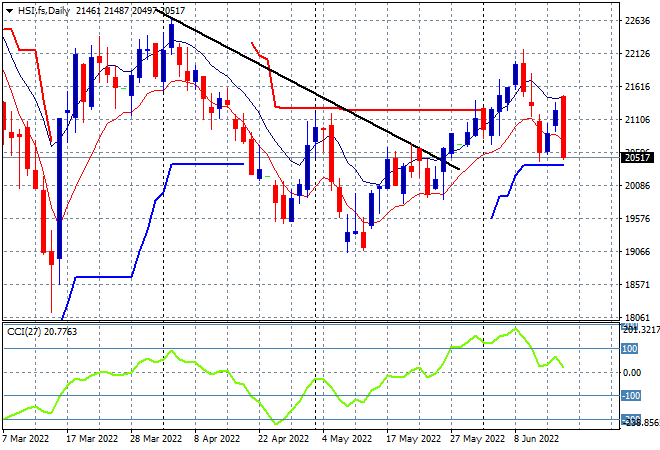
Looking at share markets in Asia from yesterday’s session, where Chinese share markets were playing catchup to the recent volatility with the Shanghai Composite down more than 0.6% to 3265 points while the Hang Seng Index lost ground very fast, closing more than 2% lower at 20845 points. The daily chart is showing price pushed right down to trailing daily ATR support at the 20500 point level with daily momentum barely positive. With these sort of correlated falls with other stock markets, its still a fair way from the May lows at the 19000 point level, but watch for any break below the 20000 point level here very closely:
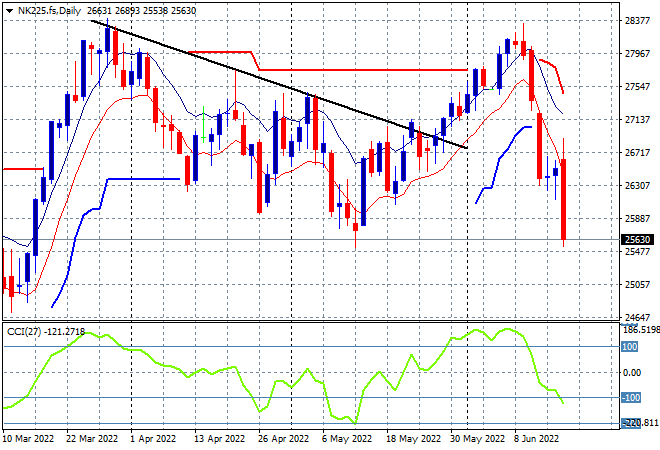
Japanese stock markets however are holding on to their bounce gains, with the Nikkei 225 index closing 0.4% higher at 26431 points. The daily futures chart of the Nikkei 225 however is showing a very sharp retracement likely on the open today, given the steep falls on Wall Street overnight, with the daily momentum getting into the oversold zone to possibly wipe out the May lows at the 25500 point area:
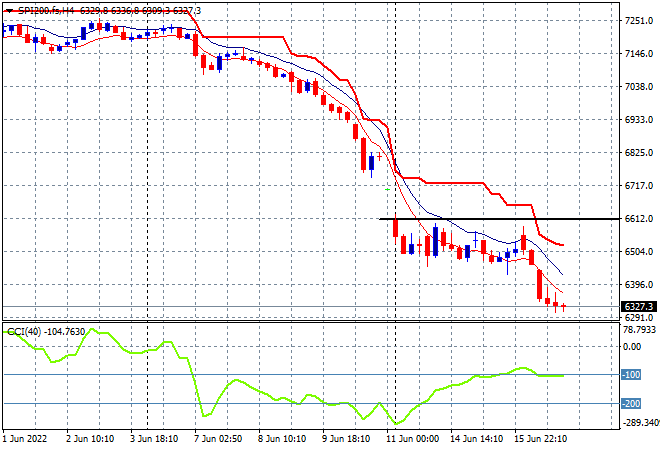
Australian stocks were doing well at the start of the session but managed to close in the red, with the ASX200 finishing 0.2% lower at 6591 points. SPI futures are down nearly 2%, indicating more carnage on the open, finishing the trading week possibly below the 6400 point area. The four hourly charts continue to show that price is in near freefall and needs to recover well above the 6600 point level before calling any bottoming action:
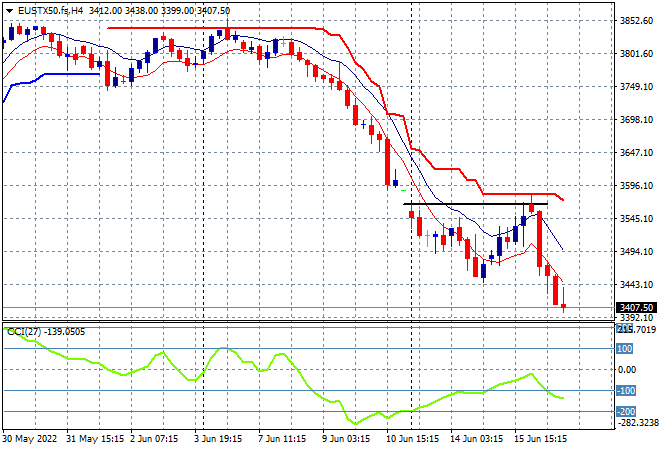
European stocks pushed aside their very modest bounces with some sour sessions post the BOE and Swiss bank rate hikes, with the Eurostoxx 50 index eventually losing nearly 3% to finish at 3427 points. The four hourly chart picture shows a similar picture to Aussie stocks with short term momentum reverting back to an oversold position as price failed to get back to the start of week gap down resistance level at the 3560 area – not pretty:
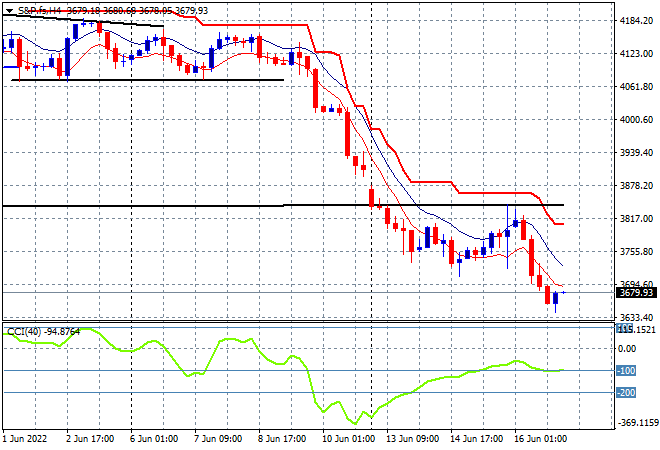
Wall Street was the most volatile again with large selloffs, lead naturally by the NASDAQ which took back its recent big bounce and then doubled down, finishing 4% lower while the S&P500 nearly did the same, closing 3.3% lower at 3666 points. Oh that’s ominous! The four hourly chart was also similar to European bourses, but had more hesitation building as the May lows remain quite broken. This is why I was highly skeptical, and while risky, adding to shorts on dead cat bounces up towards trailing ATR resistance lines can be very profitable!
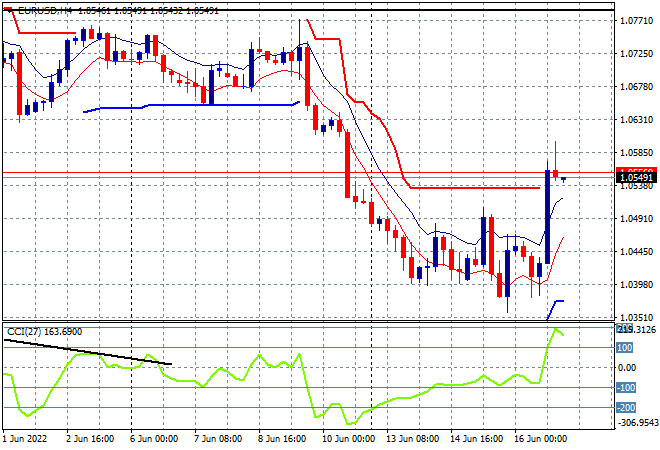
Currency markets increased in volatility due to two central bank rate rises, but this time the USD cracked with all the majors launching higher against the King, with Euro finally able to get out of its recent funk. The union currency pushed through the 1.05 handle in a big surge, after recently trying to find a bottom at the 1.04 handle. Traders are anticipating more ECB rate rises on the back of the BOE/SNB but this repricing maybe temporary so watch for any retracement below former trailing ATR resistance here:
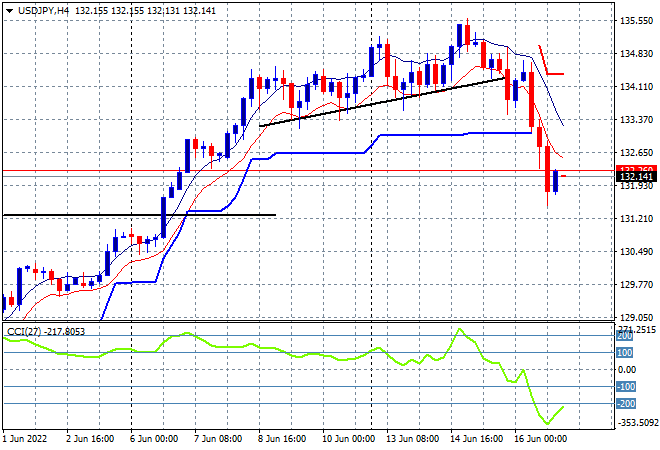
The USDJPY pair continued to selloff after holding on to the 135 level prior to the Fed meeting, and warning how the strong USD complex was about to invert with a drop below the modest trendline from last weeks breakout. Short term momentum has now retraced sharply to oversold levels as it wipes out the last two weeks of gains down to the 132 handle, taking out the trailing ATR support zone at the 133 level. As I’ve been warning for quite some time, this has proven a good area to lock in profits but there’s definitely more volatility coming:
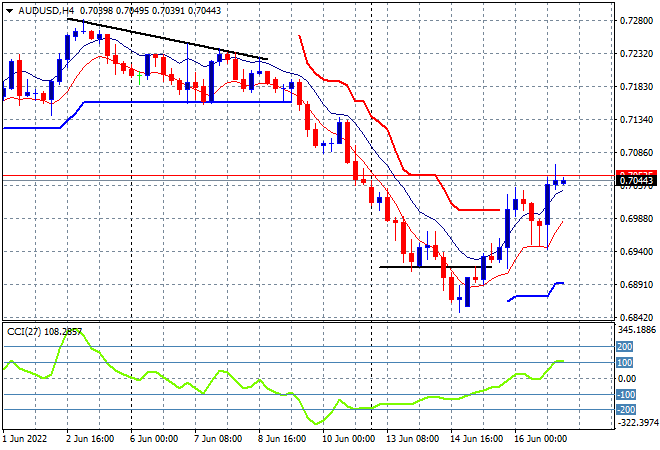
The Australian dollar continued its bounce back with a second return above the 70 handle after an initial attempt faltered post the FOMC rate rise. While the RBA is likely to follow suit there is still a sizeable gap between the interest rate structures, so I still contend the USD will continue to crush the Pacific Peso. In the short term however, any follow through above the 70 handle may turn this swing only position into a possible return to former weekly support around the 71.30 level:
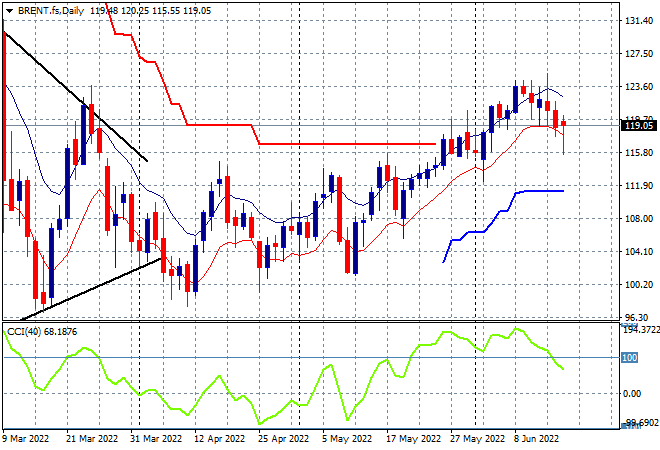
Oil markets had downside volatility but were able to fill the gaps by the close with Brent crude dipping down to the $115USD per barrel level before recovering to $119, somewhat shaking the weekly trend. Daily momentum has retraced from its overbought status while price continues to be supported at the $115 area, as I said previously, it mustn’t close below the low moving average next or previous ATR trailing resistance:
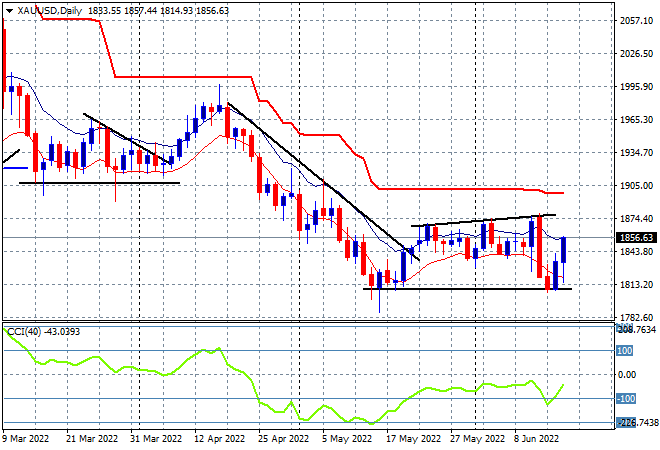
Gold was able to bounce back again overnight after recently selling off down to the $1800USD per ounce level, finishing with a second new daily high at $1856. This is a good beginning for a possible swing trade back up to the $1880 level but is early days with momentum still quite negative, but shows that support at the $1800 level is firmer than expected:
Glossary of Acronyms and Technical Analysis Terms:
ATR: Average True Range – measures the degree of price volatility averaged over a time period
ATR Support/Resistance: a ratcheting mechanism that follows price below/above a trend, that if breached shows above average volatility
CCI: Commodity Channel Index: a momentum reading that calculates current price away from the statistical mean or “typical” price to indicate overbought (far above the mean) or oversold (far below the mean)
Low/High Moving Average: rolling mean of prices in this case, the low and high for the day/hour which creates a band around the actual price movement
FOMC: Federal Open Market Committee, monthly meeting of Federal Reserve regarding monetary policy (setting interest rates)
DOE: US Department of Energy
Uncle Point: or stop loss point, a level at which you’ve clearly been wrong on your position, so cry uncle and get out!wrong on your position, so cry uncle and get out!