
As expected, the Federal Reserve hiked rates by 0.75% which had mostly been priced in by risk markets losing their you-know-what in the previous week of sell offs. This created a bounce opportunity with Wall Street and European stocks lifting between 1-2% overnight. In currency land, the USD pulled back from its 20 year high, with the Aussie and Kiwi making strong gains, relatively speaking. Bond markets saw a retreat in yields, with 10 year Treasuries pulled back from the 3.5% level to just below 3.3% with interest rate futures still suggesting more rate rises on the way, so again – all relative! Commodity prices were mixed across the whole complex, with oil prices retracing slightly as Brent crude fell below the $120USD per barrel level, while gold lifted nearly 2% after bouncing off the $1800USD per ounce level.
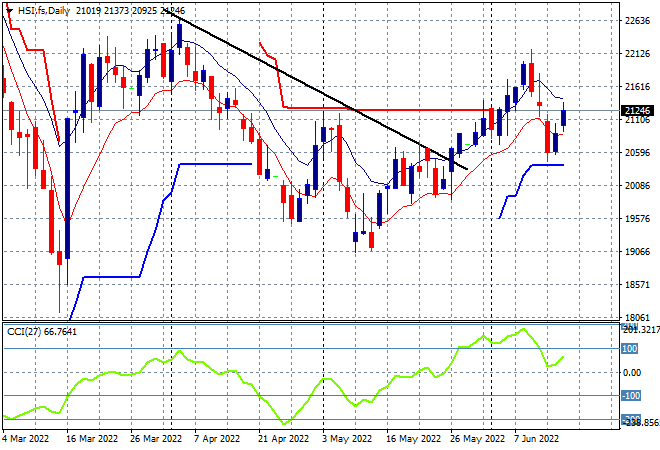
Looking at share markets in Asia from yesterday’s session, where Chinese share markets ignored all the downside volatility with the Shanghai Composite closing up more than 0.5% to 3305 points while the Hang Seng Index went even further, closing 1.1% higher at 21308 points. The daily chart is showing price holding above trailing daily ATR support at the 20500 point level with previously overbought daily momentum still positive. There has not been the same sort of correlated falls with other stock markets as its still a fair way from the May lows at the 19000 point level, with another small rally up towards 22000 more likely:
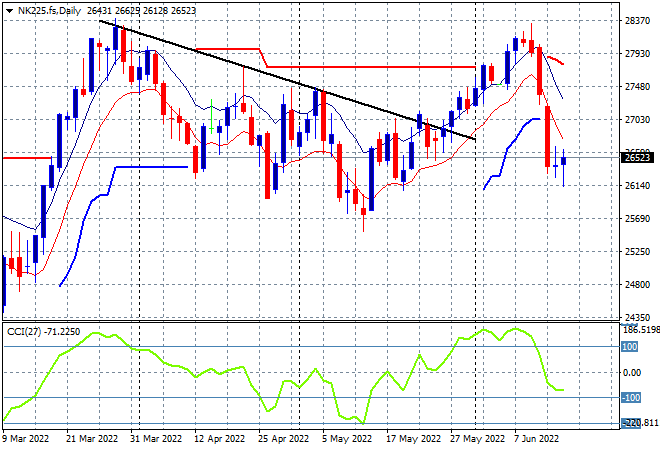
Japanese stock markets however continued their pullback, with the Nikkei 225 index losing 1% to finish at 26326 points. The daily futures chart of the Nikkei 225 shows how quick this retracement has occurred right after stalling out where it matters most as it failed to clear monthly resistance at the 28000 point area. Daily momentum has retraced fully from its overbought position but is not yet in an oversold position as price action does indicate a potential bottoming action here at the 26000 point level. Futures are suggesting a small bounce on the open this morning, even though Yen appreciated somewhat overnight:
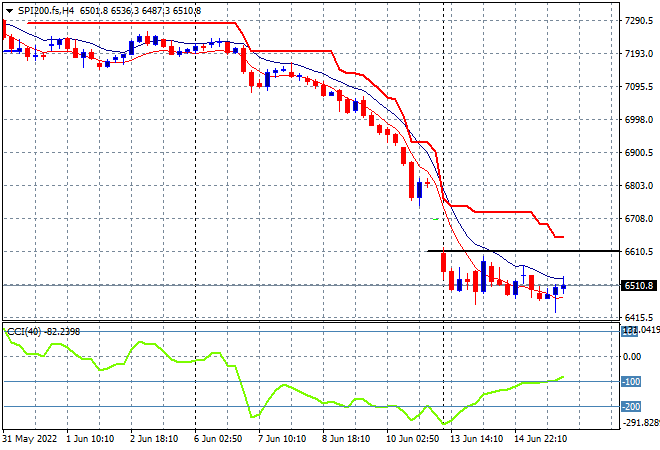
Australian stocks were still selling off, with another 1.2% lost in yesterday’s session, pushing losses to over 10% in the last 12 months for the ASX200 as it closes just above the 6600 point level. SPI futures are only indicating limited upside, around 0.4% or so to maintain around the 6600 point area. The four hourly charts continue to show that price is still quite depressed and needs a large upside move above the Monday morning gap down open to call this even the hint of a bottom:
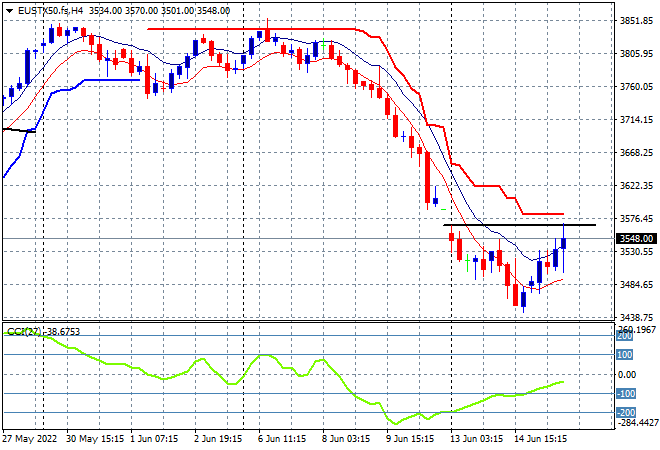
European stocks all had modest bounces leading up to the FOMC meeting with the Eurostoxx 50 index lifting some 1.3% to finish at 3532 points. The four hourly chart picture shows a similar picture to Aussie stocks however, there are more signs of a potential swing action building here as short term momentum retraces from an oversold position and price tries to get back to the start of week gap down resistance level at the 3560 area:
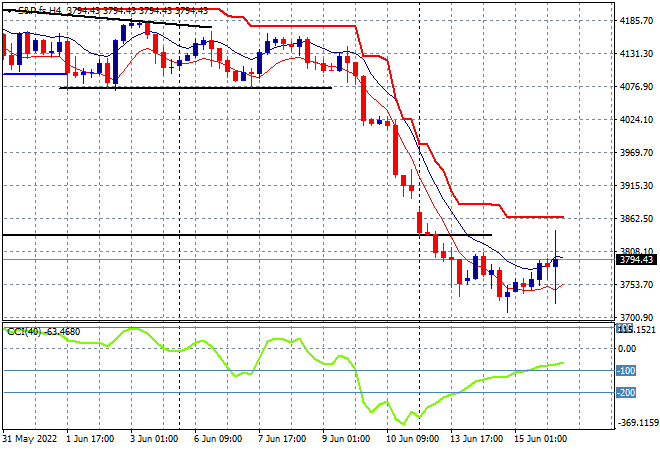
Wall Street was volatile again with large trading ranges that eventually saw a sizeable bounceback, with the NASDAQ lifting 2.5% while the S&P500 gained more than 1.4% but still didn’t manage to climb back above the 3800 point level. The four hourly chart is similar to European bourses, but with more hesitation building as the May lows remain quite broken through and will continue to act as firm resistance going ahead. While price action is decelerating, and short term momentum is reverting for a swing trade I remain highly skeptical:
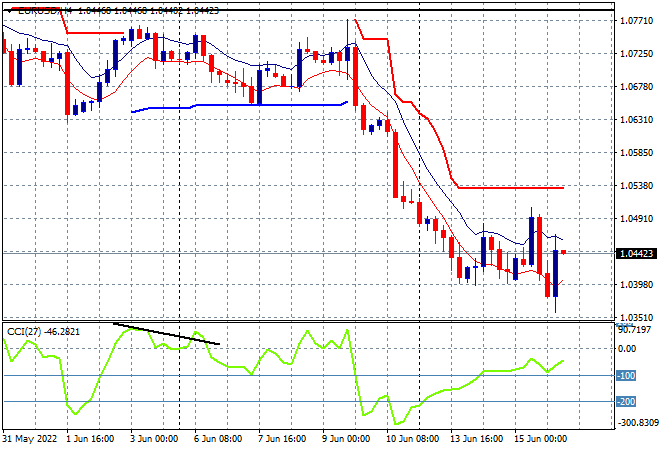
Currency markets increased in volatility overnight obviously due to the FOMC rate rise, but it was swings and roundabouts for the ever strong USD with Euro still unable to get out of its pity party. The union currency continues to confirm the bearish weekly rounding top pattern, remaining stuck at the 1.04 handle. Price action has been contained by resistance at the 2020 lows (upper horizontal black line), and while the ECB is indicating rate rises are forthcoming, they are behind the ball for now, which keeps the pressure on:
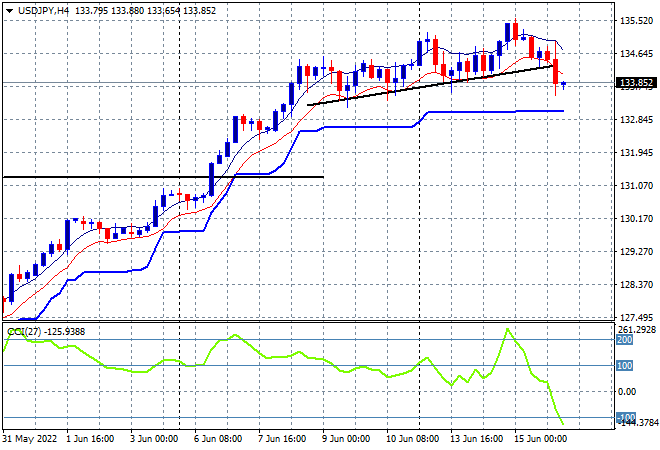
The USDJPY pair finally broke, relatively speaking after drifting higher and well above the 135 level prior to the Fed meeting, now dropping below the modest trendline from last weeks breakout. Short term momentum has now retraced sharply from its previously highly overbought levels but price action remains above the trailing ATR support zone at the 133 level. As I’ve been warning for quite some time, this has proven a good area to lock in profits but also to add to further short Yen positions once the post Fed volatility is washed through:
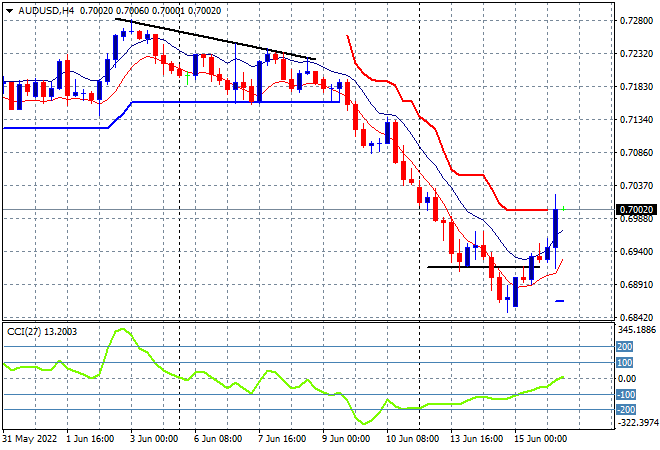
The Australian dollar bounced back the strongest, with a swift return to the 70 handle although it may have gotten ahead of itself before it even started following the FOMC rate rise. The RBA is likely to follow suit but there is still a sizeable gap between the interest rate structures, so I still contend the USD will continue to crush the Pacific Peso. In the short term, watch for any follow through above the 70 handle that turns this swing only position into a possible return to former weekly support around the 71.30 level:
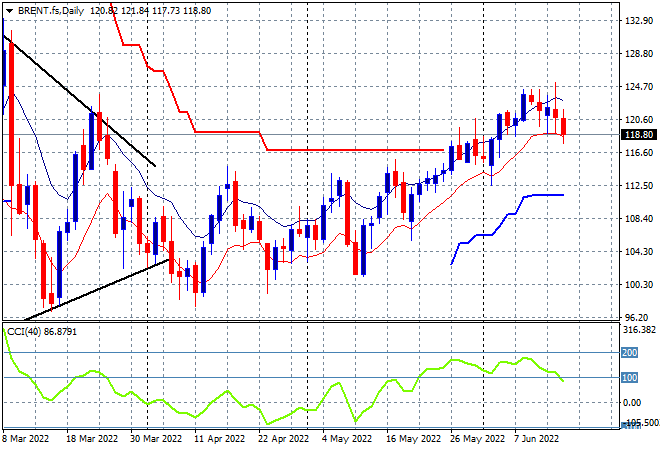
Oil markets are still absorbing the risk off volatility although Brent crude has deflated below the $120USD per barrel area slightly, with the weekly trend just intact. Daily momentum has retraced from its overbought status after rolling over recently and while price continues to be supported at the $115 area, it mustn’t close below the low moving average next or the sellers will step in swiftly. My contention of a return to the Ukrainian invasion highs at or above the $140 level still holds as long as price stays above previous ATR trailing resistance at the $115 area:
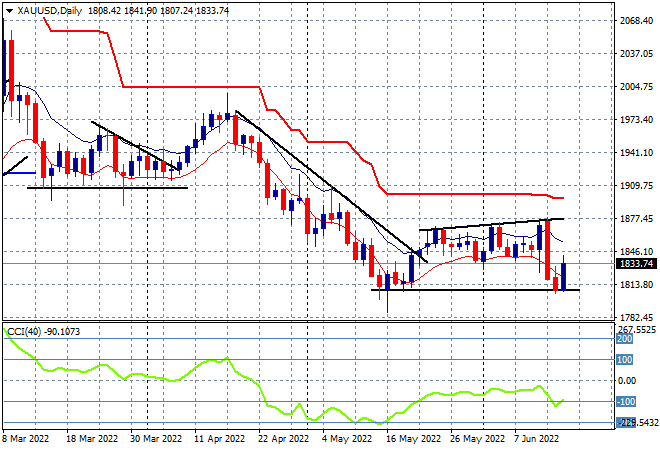
Gold was able to bounce back slightly overnight after recently selling off down to the $1800USD per ounce level, finishing with a new daily high at $1833. This is a good beginning for a possible swing trade back up to the $1880 level but is early days with momentum still quite negative, but shows that support at the $1800 level is firmer than expected:
Glossary of Acronyms and Technical Analysis Terms:
ATR: Average True Range – measures the degree of price volatility averaged over a time period
ATR Support/Resistance: a ratcheting mechanism that follows price below/above a trend, that if breached shows above average volatility
CCI: Commodity Channel Index: a momentum reading that calculates current price away from the statistical mean or “typical” price to indicate overbought (far above the mean) or oversold (far below the mean)
Low/High Moving Average: rolling mean of prices in this case, the low and high for the day/hour which creates a band around the actual price movement
FOMC: Federal Open Market Committee, monthly meeting of Federal Reserve regarding monetary policy (setting interest rates)
DOE: US Department of Energy
Uncle Point: or stop loss point, a level at which you’ve clearly been wrong on your position, so cry uncle and get out!wrong on your position, so cry uncle and get out!