
A bath of blood or AKA wiping out all of 2021’s returns overnight as stock markets crashed on Wall Street. A bear market in stocks is fully underway, while the arse fell out of the crypto world, which may be more damaging overall. The USD smashed everything undollar with a 1% price rise on the USDX, with Euro, Pound Sterling and the commodity currencies all suffering, with the Australian dollar almost below the 69 cent level for a new monthly low. Bond markets saw a big move higher in yields, with 10 year Treasuries now at a decade high, up through the 3.4% level to surpass the S&P500 dividend yield. Commodity prices fell back although oil remains strong, with Brent crude still above the $120USD per barrel level, while iron ore and gold dropped more than 2% as the latter was pushed down to a new monthly low after a false breakout to start the week.
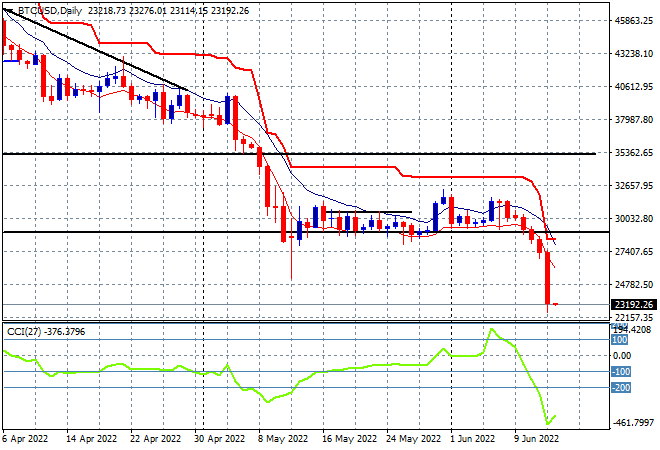
Bitcoin first though – like a Stuka!
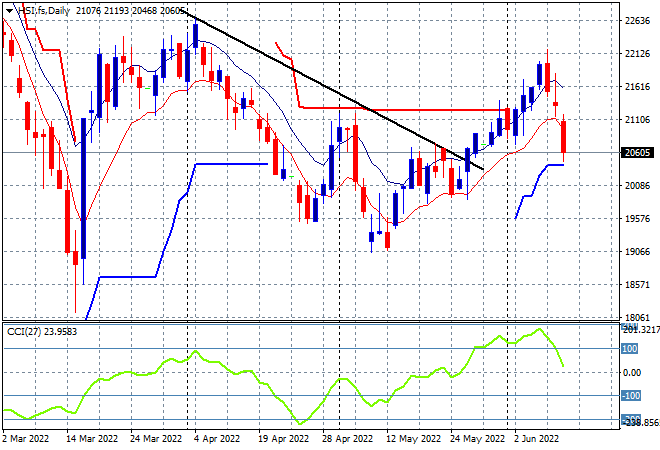
Looking at share markets in Asia from Friday’s session, where Mainland Chinese share markets are the best of the bunch but still selling off with the Shanghai Composite closing down 1.1% to 3248 points while the Hang Seng Index was hammered, down nearly 3.6%, closing at 21102 points. The daily chart is showing price accelerating below former trailing daily ATR resistance at the 21000 point level with overbought daily momentum now barely positive. This will likely translate into similar falls alongside other risk markets but its still a fair way from the May lows at the 19000 point level as the next target:
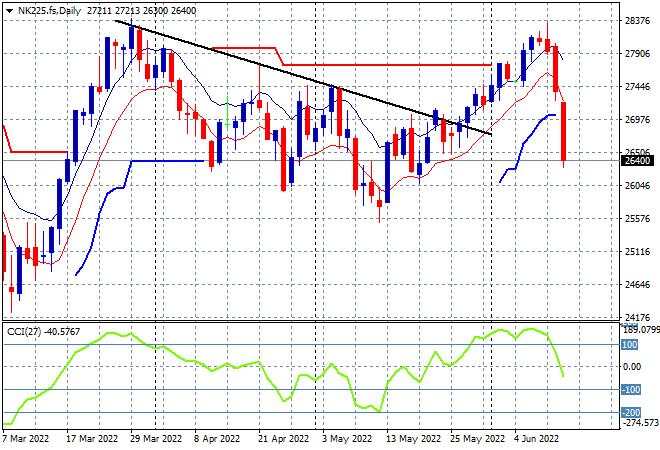
Meanwhile Japanese stock markets had a similar steep pullback, with the Nikkei 225 index losing 3% to 26987 points. The daily futures chart of the Nikkei 225 shows how quick this retracement has occurred right after stalling out where it matters most as it failed to clear monthly resistance at the 28000 point area. Daily momentum has retraced fully from its overbought position with price action not helped by the weaker Yen with futures indicating more downside on the open today:
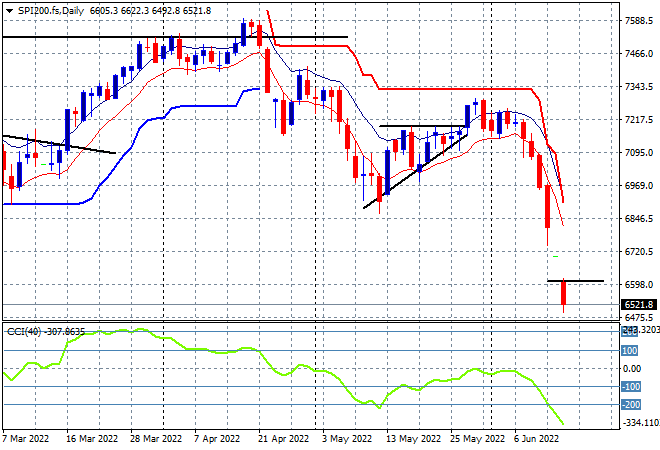
Australian stocks were closed yesterday for a public holiday and are likely to crack well below the 6700 point level on the open this morning as SPI futures are off by at least 2.5% to crush the open. It won’t be just the May lows that will be completely taken out in this move and pushes Aussie stocks into bear market territory, just in time for property to start falling at the same time:
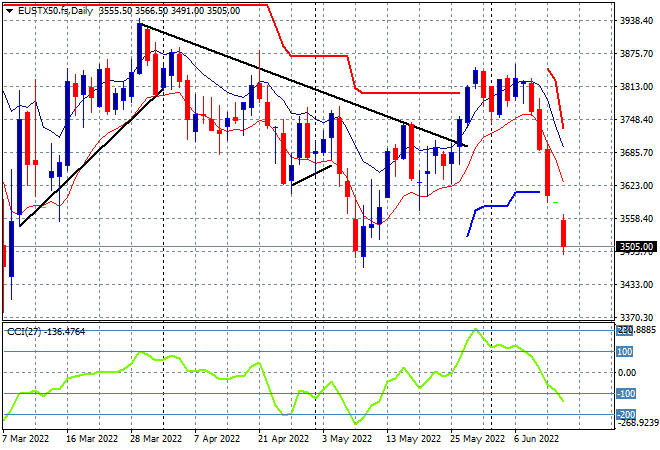
European stocks continued their own selloff with more big falls across the continent and Brexit-land, with the Eurostoxx 50 index finishing 2.7% lower at 3501 points. The daily chart picture shows capitulation quite clearly with a mammoth gap down after falling two straight sessions before ahead. Not quite yet below the May lows, but almost there but it doesn’t matter as all of 2021 gains are now lost:
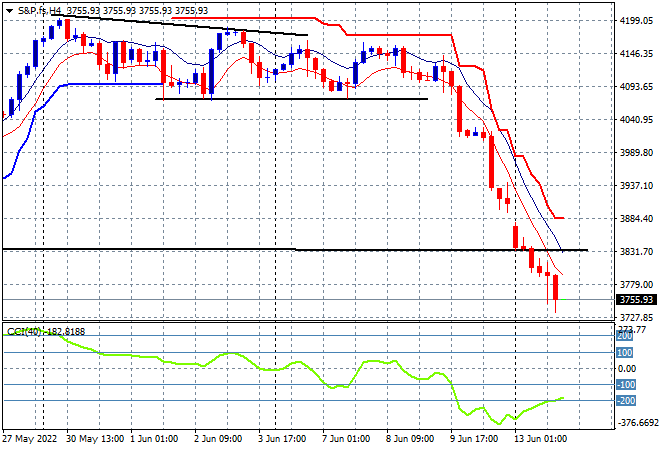
Wall Street was dumped across the board, and then some, with the NASDAQ led the way with the steepest falls, down more than 4.5%, wiping out the May “dip” lows. Meanwhile the S&P500 lost 3.9% to cave in below the 3800 point level, repeating the same pattern. The four hourly chart shows how the May lows were broken through quite convincingly and will probably act as resistance going ahead here as this rout widens:
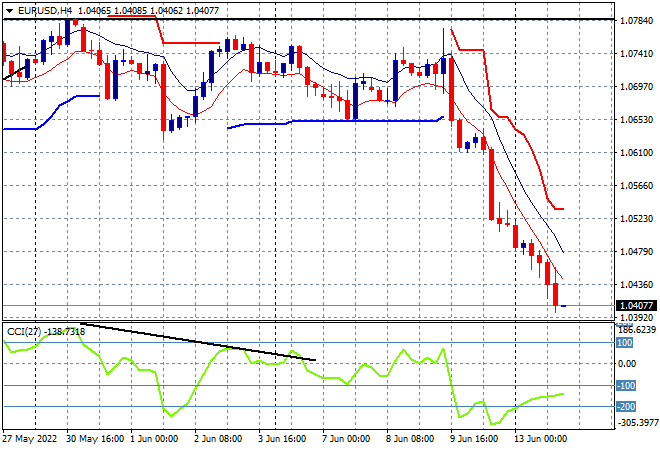
Currency markets had similar volatility as the ever strong USD continues to crush all the undollars with Euro leading the charge again, as last week’s ECB meeting becomes a distant memory. The union currency pushed straight down into a new monthly low right on the 1.04 level, accelerating the bearish weekly rounding top pattern. Price action had been contained by resistance at the 2020 lows (upper horizontal black line), for sometime now, with this crushing move setting up for a new run back to parity:
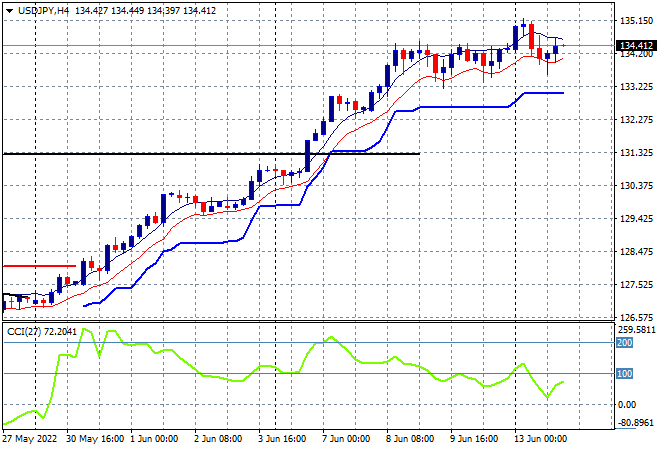
The USDJPY pair was the most stable pair again, pulling back slightly from a new daily high as it remains resilient above the 134 level, having broadcast for awhile now that USD is still dominant. Short term momentum has slowly retraced from highly overbought levels but is building yet again, suggesting more upside action. Continuing to use trailing ATR support here will lock in profits and indicate any turning of the tide:
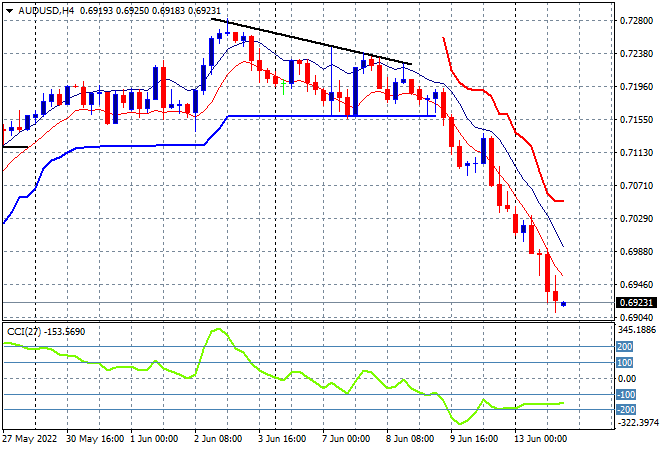
The Australian dollar was hit hard again following the previous session moves, this time moving straight down to the 69 handle for a new monthly low, as the recent 50 bps rise by the RBA becomes a distant memory. The USD is still crushing the Pacific Peso, which leaves the RBA in a pickle as imported inflation is about to zoom higher, with momentum hugely oversold and price action retracing all of the previous monthly gains and back below the previous weekly resistance level:
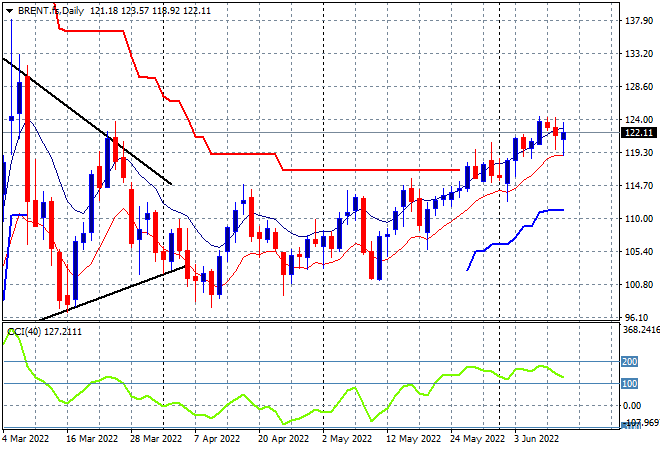
Oil markets are still absorbing the risk off volatility relatively easy with Brent crude maintaining a strong level here at the $120USD per barrel area, with the weekly trend quite intact. Daily momentum remains nicely overbought, although is rolling over slightly, and price continues to be supported at the $115 area very firmly, so my contention of a return to the Ukrainian invasion highs at or above the $140 level still holds as long as price stays above the low moving average:
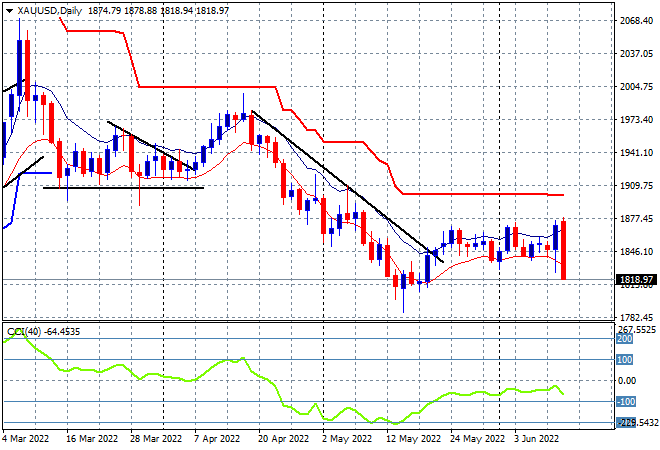
Gold was looking to be the odd one out but was crushed overnight with a strong selloff almost down to the $1800USD per ounce level. The leapfrog of the $1850 wobbly support level was signalling a big change here but as I cautioned yesterday, you have to clear obvious levels of resistance and this was not done at all before the crush. In fact, the bearish engulfing candle (where price starts above previous highs but finishes below previous lows) is a very ominous single day price action:
Glossary of Acronyms and Technical Analysis Terms:
ATR: Average True Range – measures the degree of price volatility averaged over a time period
ATR Support/Resistance: a ratcheting mechanism that follows price below/above a trend, that if breached shows above average volatility
CCI: Commodity Channel Index: a momentum reading that calculates current price away from the statistical mean or “typical” price to indicate overbought (far above the mean) or oversold (far below the mean)
Low/High Moving Average: rolling mean of prices in this case, the low and high for the day/hour which creates a band around the actual price movement
FOMC: Federal Open Market Committee, monthly meeting of Federal Reserve regarding monetary policy (setting interest rates)
DOE: US Department of Energy
Uncle Point: or stop loss point, a level at which you’ve clearly been wrong on your position, so cry uncle and get out!wrong on your position, so cry uncle and get out!