
Not good for risk takers out there with Wall Street slumping overnight following a hawkish ECB which kept its rates on hold as expected, but signaled two more rate hikes coming very shortly. The USD smashed everything undollar with Euro down on the ECB hold while the Australian dollar broke through 71 cent level in one swift move. Bond markets saw a lifting of yields everywhere, including Bunds and Gilts and 10 year Treasuries, which pushed up to a new high at the 3.07% level. Commodity prices fell back but oil remains strong, with Brent crude barely off by 1% while copper dropped 2% and gold drifted below the $1850USD per ounce level.
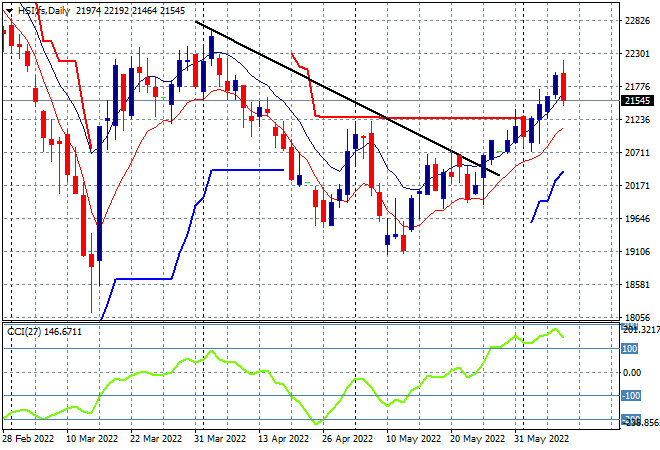
Looking at share markets in Asia from yesterday’s session, where mainland Chinese share markets fell sharply after the lunch break with the Shanghai Composite closed down 0.7% to 3238 points while the Hang Seng Index gave back more than half of its previous gains, finished 0.6% lower to retrace below the 22000 point level at 21869 points. The daily chart was showing price accelerating after breaking above trailing daily ATR resistance at the 21000 point level with overbought daily momentum helping translate into greater highs, but this stumble could take remove the March highs near the 23000 point level as the next target:
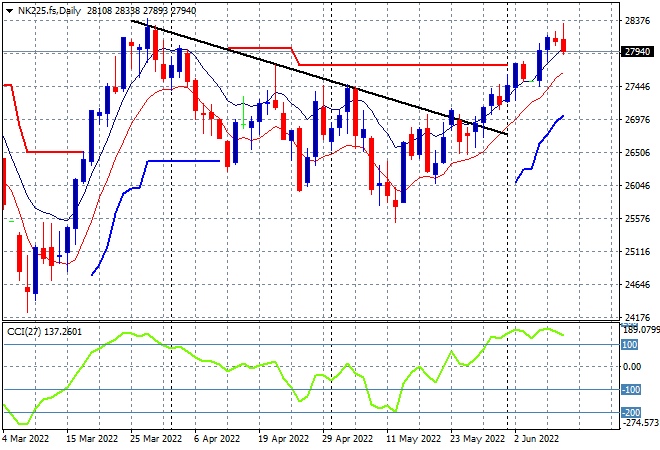
Meanwhile Japanese stock markets put in scratch sessions, with the Nikkei 225 index closing just 0.1% higher at 28246 points. The daily chart of the Nikkei 225 is also showing a strong move back above the previous daily/weekly highs, with the March highs also in sight but stalling where it matters most. Daily momentum remains nicely overbought and a much weaker Yen will help here but it may not be enough to forestall correlated risk sell offs:
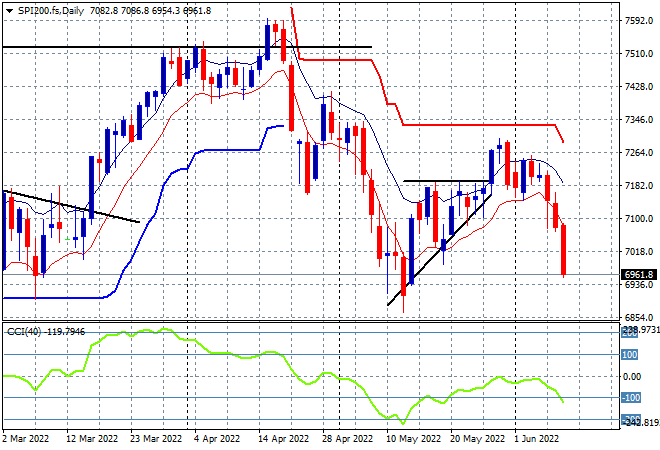
Australian stocks were the biggest losers again with the ASX200 losing almost 1.5% to finish at 7019 points. SPI futures are down more than 60 points or 0.5% on the big drop on Wall Street overnight, so we’re likely to see the 7000 point level and the May lows taken out. The substantial resistance at the 7200 point level and sustained daily negative momentum readings continue to suggest downside as the economy rolls over and stocks price in more rate rises that will kill demand:
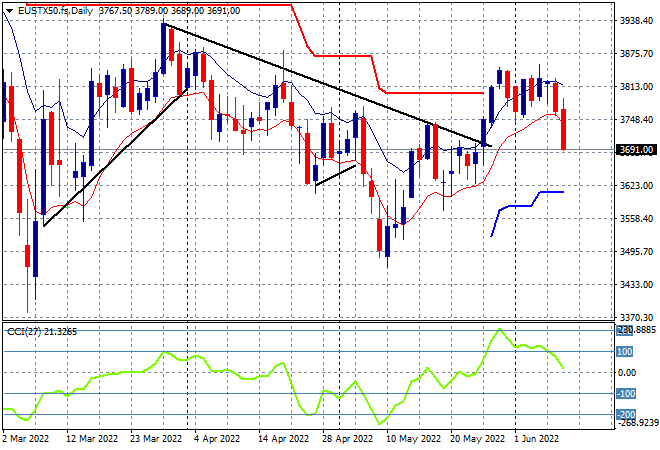
European stocks still can’t find any buying support yet again with broad losses across the continent and Brexit-land, with the Eurostoxx 50 index finishing off by 1.7% to 3724 points. The daily chart picture was showing a breakout condition but having stalled above the trailing ATR resistance level and creating lower daily lows spelled doom. With a close below the low moving average the next stage is a possible return below the weekly downtrend line, with 3600 points the next target here:
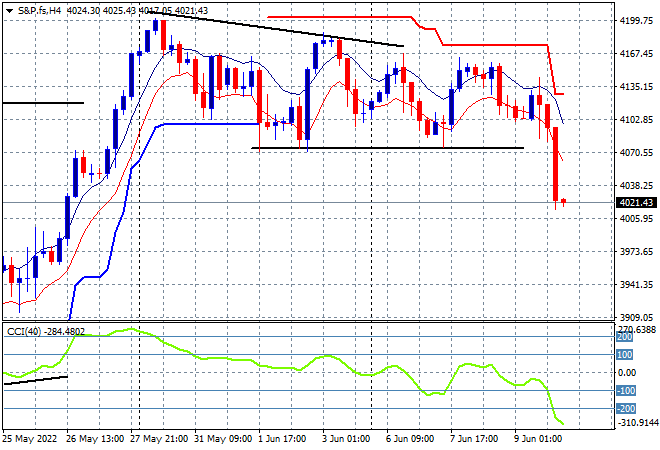
Wall Street was dumped across the board, with the NASDAQ leading the way, off by more than 2.7% while the S&P500 lost 2.4% to almost break through the 4000 point level, finishing at 4016 points. The four hourly chart was showing strong support at the 4100 point level that had held, but resistance was too strong overheard to overcome the fears of a rampant Fed, crushing confidence below. The key level to watch now is the psychologically important 4000 points which if broken, will see a swift return to the May lows below 3800 or lower:
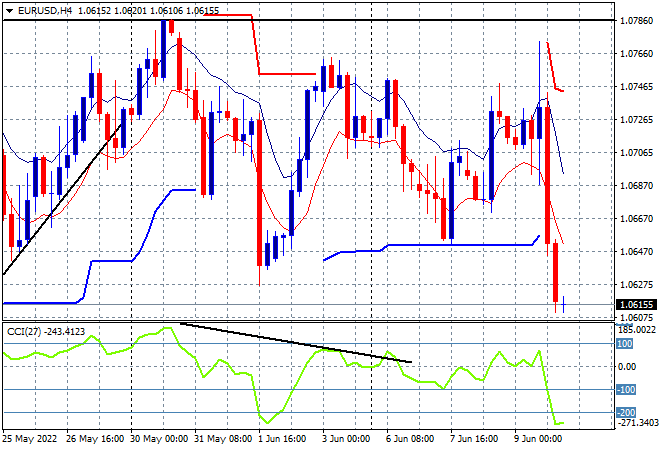
Currency markets are showing their hand with the perennially strong USD crushing all the undollars with Euro leading the charge following last nights ECB meeting. The union currency was pushed straight down into a new weekly low at the 1.06 level almost confirming the bearish weekly rounding top pattern. Price action had been contained by resistance at the 2020 lows (upper horizontal black line), for sometime now, with my call for a rollover to gather pace and threaten last week’s lows at the 1.06 level nearly fulfilled here:
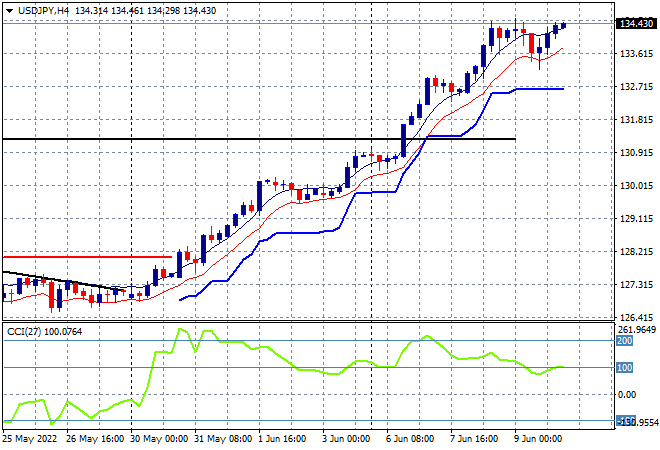
The USDJPY pair was the most stable pair overnight, basically returning to the intrasession high at just below the mid 134 level, having broadcast for awhile now that King Dollar is not to be trifled with. Short term momentum might be slowly retracing from highly overbought levels yet this is not translating into proper price action retracements. Continuing to use trailing ATR support here will lock in profits and indicate any turning of the tide:
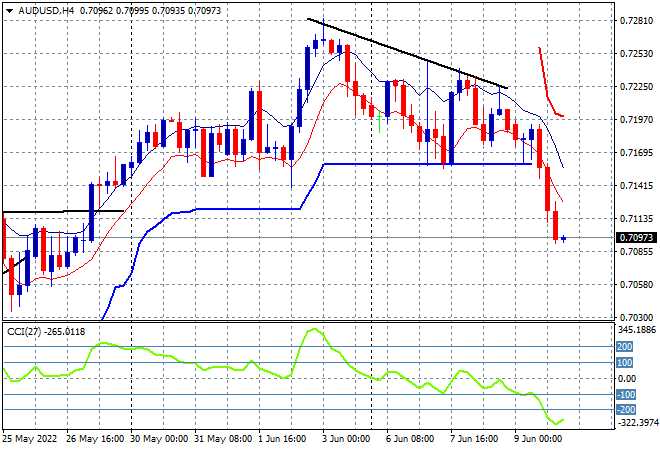
The Australian dollar was whallopped on the risk off move overnight, pushing right through the 71 handle for a new weekly low despite the recent 50 bps rise by the RBA. Its not enough, the USD is going to crush the Pacific Peso, with momentum hugely oversold and price action now below previous resistance level at 71 cents (upper black horizontal line from last week). The 70 handle is in sight next:
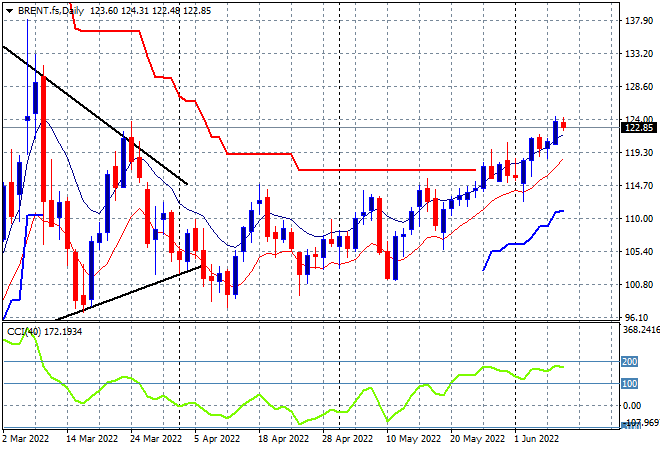
Oil markets are absorbing the risk off volatility wit aplomb with Brent crude remaining well above the $120USD per barrel level to hold on to the three monthly high, with the weekly trend quite intact. Daily momentum remains nicely overbought and price has been supported at the $115 area so this could add up to more upside and a return to the Ukrainian invasion highs at or above the $140 level:
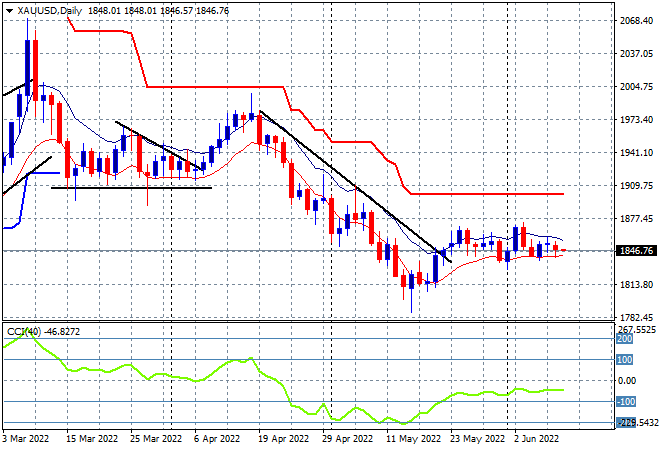
Gold still can’t find any buying support, retracing below the $1850USD per ounce support level to make a slightly lower new daily low in this long drawn out process. I’ve been pointing to the lack of a new daily high for sometime now, as a sign that this bounce from the January lows around the $1800 level was not sustainable, but it still hasn’t turned into a rout which does indicate some buying support. However, the lack of positive daily momentum keeps this a low probability swing trade for now with trailing overhead ATR resistance not under any threat:
Glossary of Acronyms and Technical Analysis Terms:
ATR: Average True Range – measures the degree of price volatility averaged over a time period
ATR Support/Resistance: a ratcheting mechanism that follows price below/above a trend, that if breached shows above average volatility
CCI: Commodity Channel Index: a momentum reading that calculates current price away from the statistical mean or “typical” price to indicate overbought (far above the mean) or oversold (far below the mean)
Low/High Moving Average: rolling mean of prices in this case, the low and high for the day/hour which creates a band around the actual price movement
FOMC: Federal Open Market Committee, monthly meeting of Federal Reserve regarding monetary policy (setting interest rates)
DOE: US Department of Energy
Uncle Point: or stop loss point, a level at which you’ve clearly been wrong on your position, so cry uncle and get out!wrong on your position, so cry uncle and get out!