
Last night saw Wall Street post some small gains while European stocks lurched forward following Friday’s release of the latest US non-farm payroll figures sent the USD higher against everything. Inflation risks are still showing everywhere with 10 year Treasury yields pushing through the 3% level again. Commodity prices were mixed with oil prices remaining at a monthly high, Brent crude sitting at the $120USD per barrel level while wheat prices soared and gold inverted back below the $1850USD per ounce level.
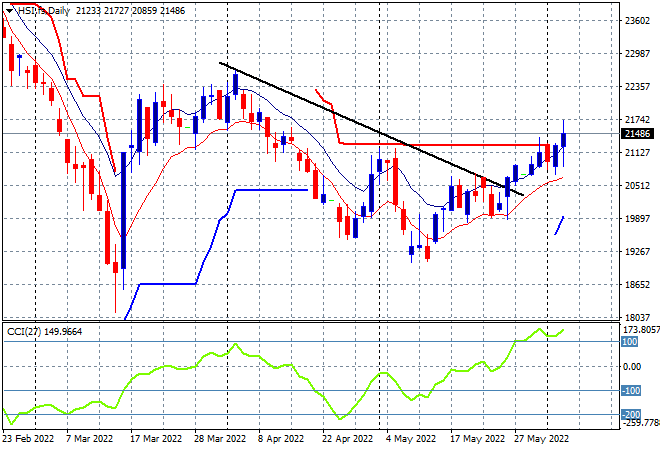
Looking at share markets in Asia from yesterday’s session, where mainland and other Chinese share markets reopened after a long weekend with the Shanghai Composite lifting 1.3% to 3236 points while the Hang Seng Index gained zoomed 2.7% higher to finish at 21653 points. The daily chart is showing price now breaking above trailing daily ATR resistance at the 21000 point level possibly moving towards a more sustainable trend. Daily momentum is still overbought with price action translating into greater highs with the March highs near the 23000 point level the next target:
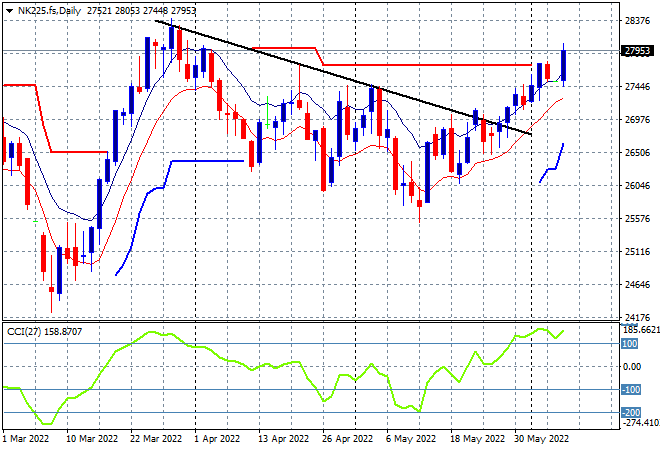
Meanwhile Japanese stock markets were also able to lift higher on the back of a weaker Yen, with the Nikkei 225 index closing 0.6% higher at 27915 points. The daily chart of the Nikkei 225 shows a strong attempt to get back above the previous daily/weekly highs near the 27500 point level. As I’ve said previously, to properly reverse the downward trend from the March highs required a substantial move above the 27000 point level with futures indicating further upside in today’s session to confirm that move:
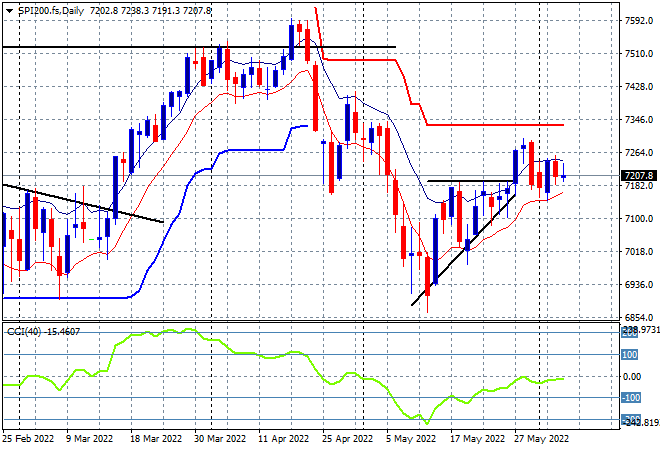
Australian stocks were the odd ones out with the ASX200 losing 0.6% to start the week at 7206 points. SPI futures are indicating a neutral to mixed start on the open, despite a positive lead from Wall Street as traders are quite wary of today’s interest rate meeting by the RBA. The daily chart was previously showing a clear breakout here last week above resistance at the 7200 point level but sustained daily negative momentum readings and choppy price action continue to suggest a false flag. Price action remains contained within the moving average band, so any actions required a substantial move either side of the band:
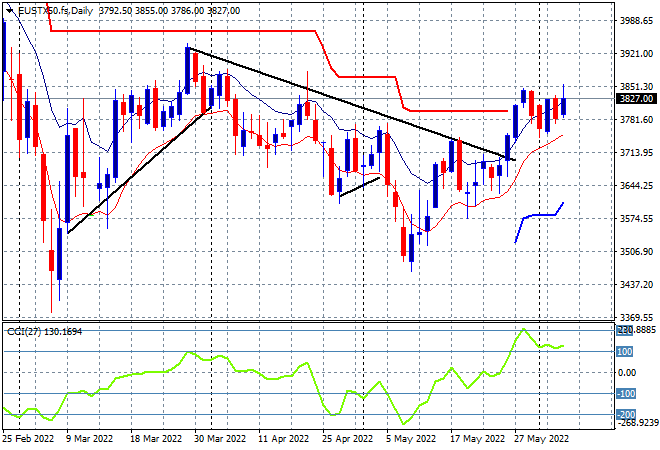
European stocks finally had some positive sessions, with a good mood across the continent as the Eurostoxx 50 index finished 1.4% higher at 3838 points. The daily chart picture is showing a better breakout condition here that while stalled above the trailing ATR resistance level is looking better with higher daily lows. This could translate into further upside as daily momentum remains slightly overbought, so watch for a breakout above the 3850 point level next:
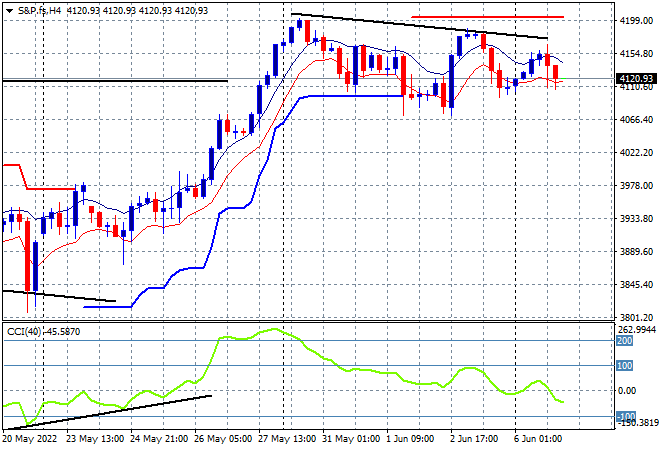
Wall Street found a modicum of buying support following Friday night’s poor reaction to a too strong NFP print with the NASDAQ lifting 0.4% while the S&P500 gained just 0.3% to at least stay above the 4100 point level, finishing at 4121 points. The four hourly chart shows clearly how firm resistance remains at the 4200 point level, now failing twice to push through as four hourly momentum indicated the lack of buying pressure. For now, support is holding at the prior resistance level at 4100 points but there’s daylight below from here if confidence evaporates:
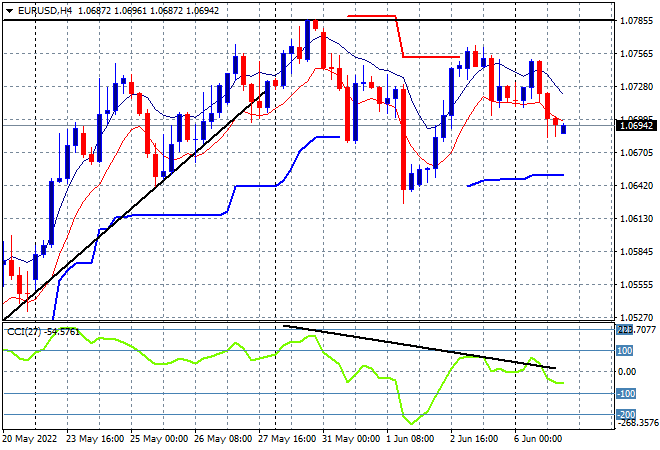
Currency markets remain in a strong USD bent with further strengthening against commodity currencies in particular. Euro lost some confidence overnight with a further retracement below the 1.07 handle as the overall picture turns into a rounding top pattern. Price action remains contained by resistance at the 2020 lows (upper horizontal black line), combined with four hourly momentum that refuses to strengthen beyond a modest neutral/positive setting, so watch for this rollover to gather pace and threaten last week’s lows at the 1.06 level:
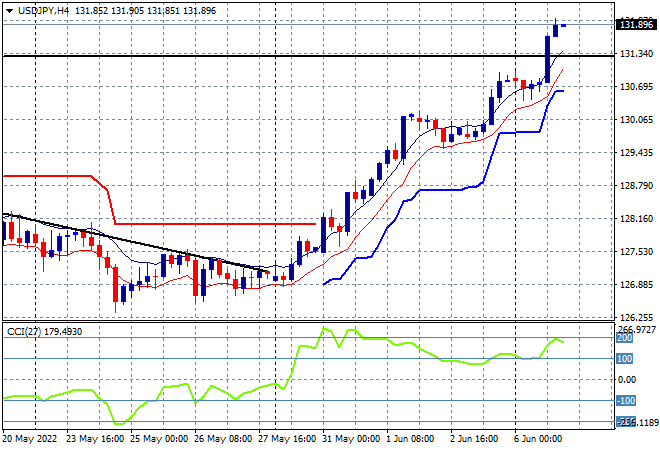
The USDJPY pair continues to zoom higher, this time breaking through the 131 level in yet another big surge following a very short consolidation period. Short term momentum didn’t even bother to retrace from highly overbought levels and while technically overdone, is not translating into actual price action retracements either. Still, using trailing ATR support here will lock in profits an indicate a turning of the tide:
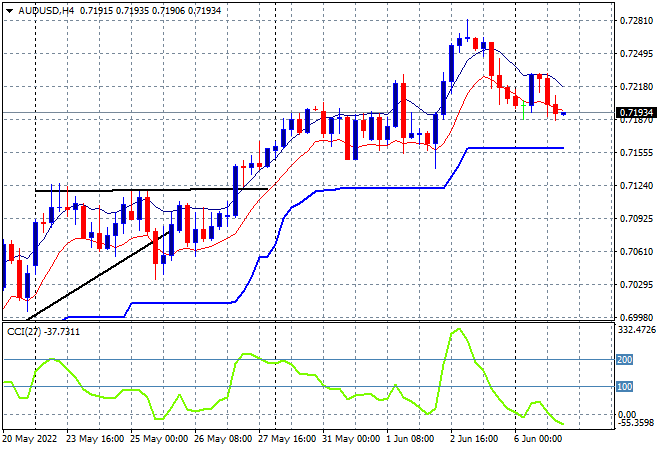
The Australian dollar is still sliding down as traders await today’s RBA meeting, which I suspect will be a little bit of wet lettuce compared to the more robust rate hike calls. Price action deflated below the 72 handle , matching last week’s starting point but not yet making a new weekly low. The previous resistance level at 71 cents (upper black horizontal line from last week) has proven solid support going forward, so watch there for today’s hike, which is likely to disappoint:
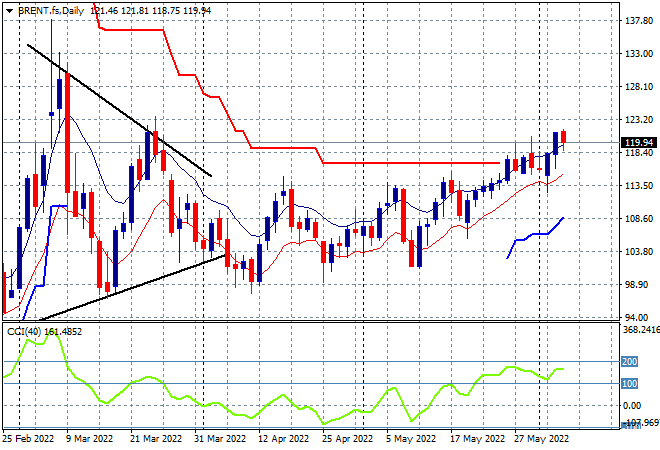
Oil markets have again failed to push higher following the Friday night rush with Brent retracing slightly below the $120USD per barrel level to still hold on to a new monthly high. This takes price back to the mid March Ukrainian high volatility period and maybe setting in a new dominant trend. Daily momentum remains nicely overbought and price has been supported at the $115 area so this could add up to more upside and a return to the $140 level:
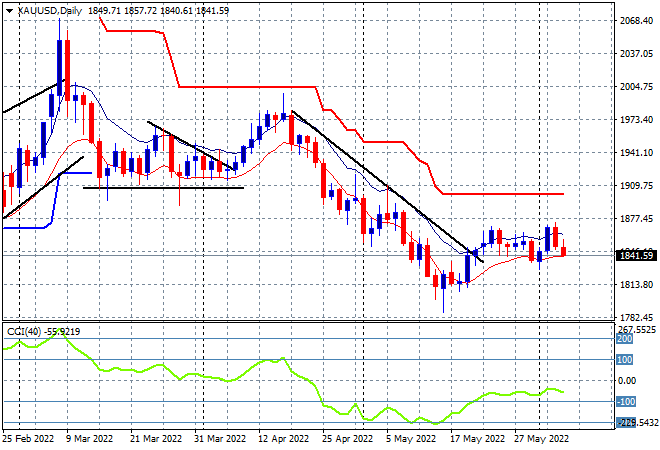
Gold however can’t find any buying support, again retracing below the wobbly $1850USD per ounce support level, after looking to and failing to make a new weekly high at the $1869 level in previous sessions. I’ve been pointing to the lack of a new daily high for sometime now, as a sign that this bounce from the January lows around the $1800 level was not sustainable. The lack of positive daily momentum keeps this is a low probability swing trade for now with trailing overhead ATR resistance also not under threat yet:
Glossary of Acronyms and Technical Analysis Terms:
ATR: Average True Range – measures the degree of price volatility averaged over a time period
ATR Support/Resistance: a ratcheting mechanism that follows price below/above a trend, that if breached shows above average volatility
CCI: Commodity Channel Index: a momentum reading that calculates current price away from the statistical mean or “typical” price to indicate overbought (far above the mean) or oversold (far below the mean)
Low/High Moving Average: rolling mean of prices in this case, the low and high for the day/hour which creates a band around the actual price movement
FOMC: Federal Open Market Committee, monthly meeting of Federal Reserve regarding monetary policy (setting interest rates)
DOE: US Department of Energy
Uncle Point: or stop loss point, a level at which you’ve clearly been wrong on your position, so cry uncle and get out!wrong on your position, so cry uncle and get out!