
Stock markets pulled back last night with the return of Wall Street from its long weekend not embiggening further risk taking. The latest US consumer confidence print was higher than expected, but bond yields lifted on another confirmation of higher inflation in Europe, with yields for 10 year Treasuries pushed up towards the 2.9% level again. Euro dropped on the EU inflation print, while the Australian dollar remained contained below the 72 cent level as Yen weakened. Commodity prices were mixed as oil prices jumped to a two month high while copper and gold both fell back more than 1%, the latter breaking below the $1850USD per ounce level .
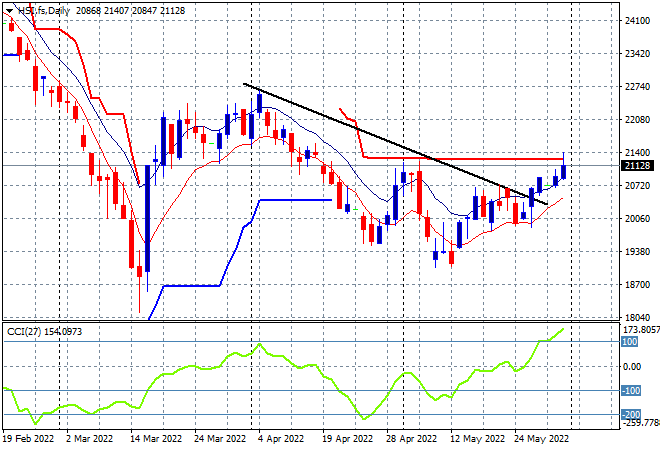
Looking at share markets in Asia from yesterday’s session, where mainland Chinese share markets surged again with the Shanghai Composite closing more than 1% higher to 3186 points while the Hang Seng Index built on its recent gains, up 1.4% to 21418 points. The daily chart is showing price pushing ever higher but still contained below trailing daily ATR resistance at the 21000 point level that has firmed as strong resistance. Daily momentum is now overbought so we should see another attempt to breakout higher today:
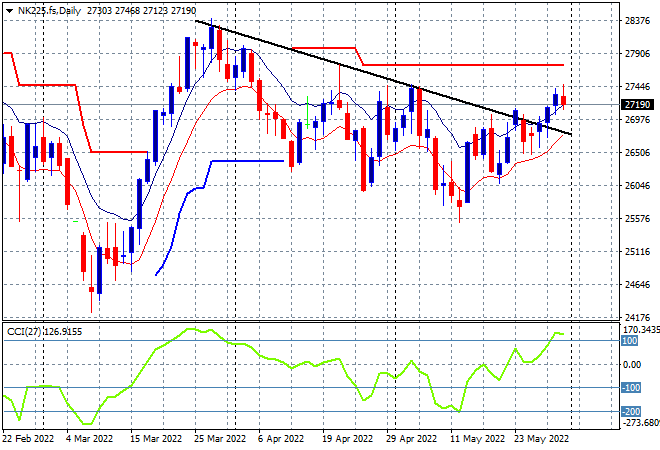
Japanese stock markets pulled back slightly after a great start in the previous session, with the Nikkei 225 index down more than 0.3% at 27279 points. The daily chart of the Nikkei 225 still has a bearish bent with another attempt to get back above the previous daily/weekly highs near the 27500 point level underway but risk sentiment is fleeting. To properly reverse the downward trend from the March highs requires a substantial move above the 27000 point level with futures indicating more downside on the open despite Yen weakening appreciably overnight:
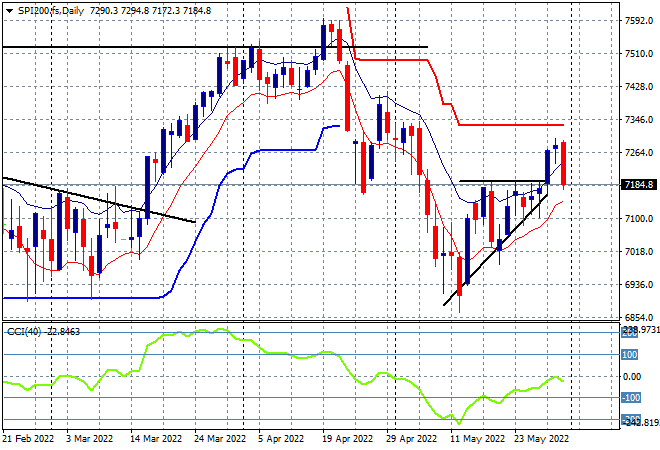
Australian stocks turned tail and ran after yesterday’s current account and building approvals prints, with the ASX200 closing more than 1% lower at 7211 points. SPI futures are down around 0.4% due to the poor lead from Wall Street overnight. The daily chart was showing a clear breakout here with resistance at the 7200 point level cleared very quickly, but the bearish engulfing candle is evidence that using daily momentum readings – which remain negative – to confirm such a move is always important! This may yet be another failed breakout:
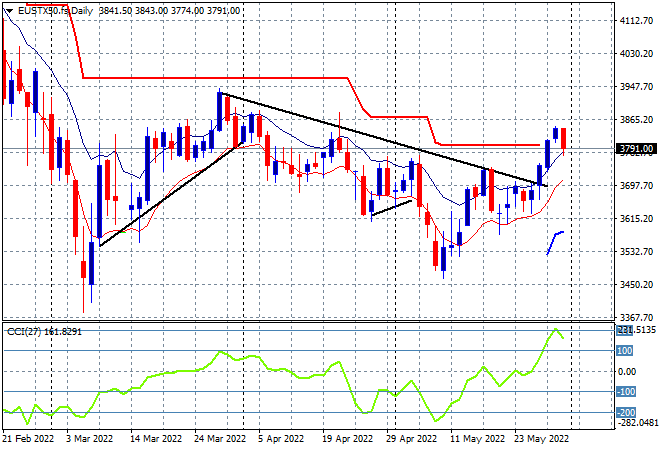
European markets did poorly overnight with only the FTSE putting on any gains (barely) as peripheral markets dragged the continent down. Overall, the Eurostoxx 50 index finished 1.4% lower at 3789 points. The daily chart picture is showing a continued breakout but last nights move has stalled above the trailing ATR resistance level that has been keeping this market contained since the Ukrainian invasion. With continued concerns about inflation, this breakout might be over before it even starts:
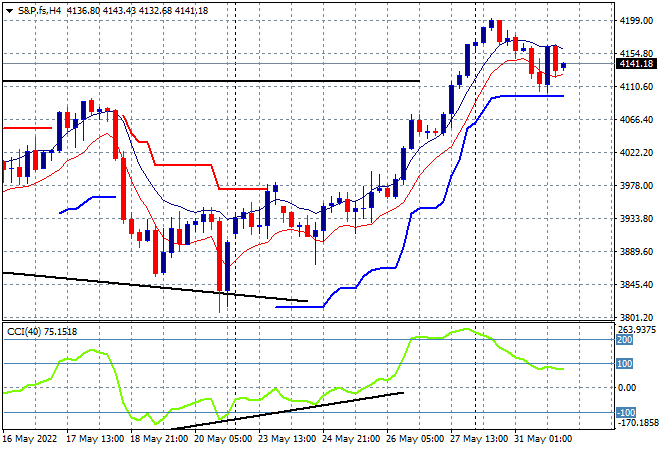
Wall Street reopened after the long weekend holiday, with the NASDAQ off by 0.6% while the S&P500 lost just 0.4% to finish at 4132 points. The four hourly chart shows how this pullback is not yet turning into a reversal with trailing ATR support at the previous 4100 point resistance level is holding amid buying exhaustion settling in. Daily momentum readings are key here – they are only barely positive so far:
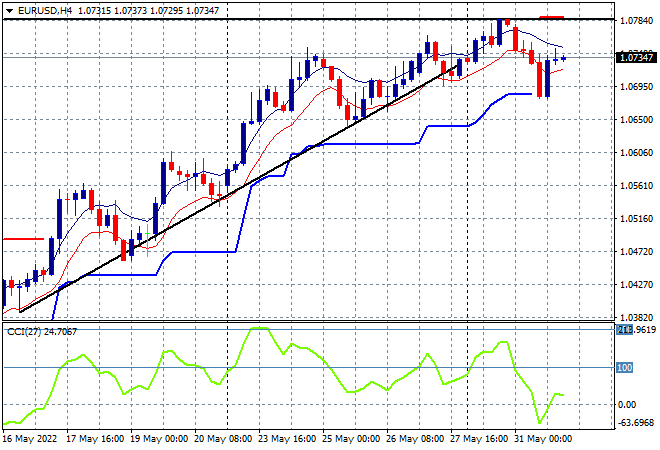
Currency markets saw continued USD weakness however it was disparate due to the concerns over European inflation as the core EU print lifted above 8% annualised. This sent Euro down below the 1.07 handle before recovering somewhat later in the session. The 2020 lows (upper horizontal black line) are acting as strong resistance here and this flop may well negate the medium term uptrend that had been solidifying:
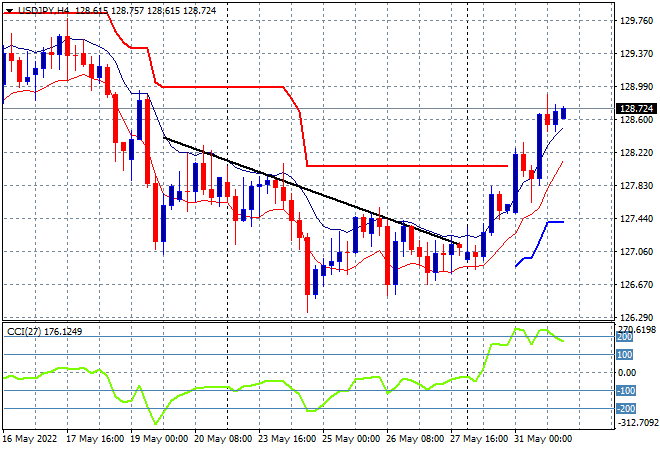
The USDJPY pair found more life overnight with a surge through the 128 level that has held on this morning, almost breaching the 129 handle in the process. Short term momentum remains highly overbought as a result, with trailing ATR resistance at the 128 handle proper cast aside, so caution can now switch to a more bullish mood:
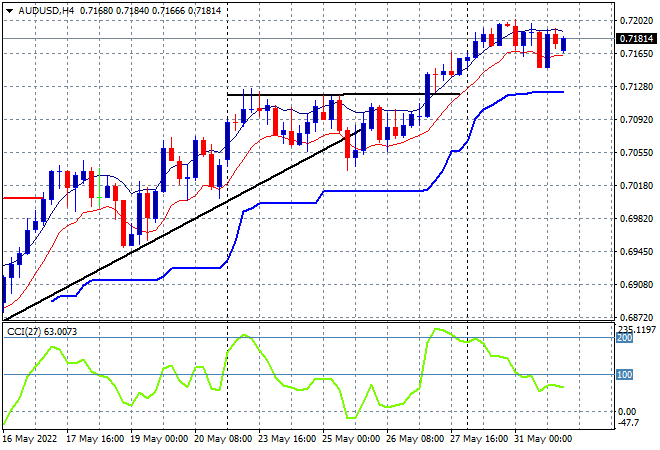
The Australian dollar tried again to push through the 72 handle overnight, continuing its Friday night moves but stalling out alongside other risk markets. Four hourly momentum has retraced from its extremely overbought levels so we could a further move down as short term price action seems to be hitting substantial resistance at the 72 cent level, or it could be more positioning before yet another breakout. The previous resistance level at 71 cents (upper black horizontal line) should provide solid support going forward:
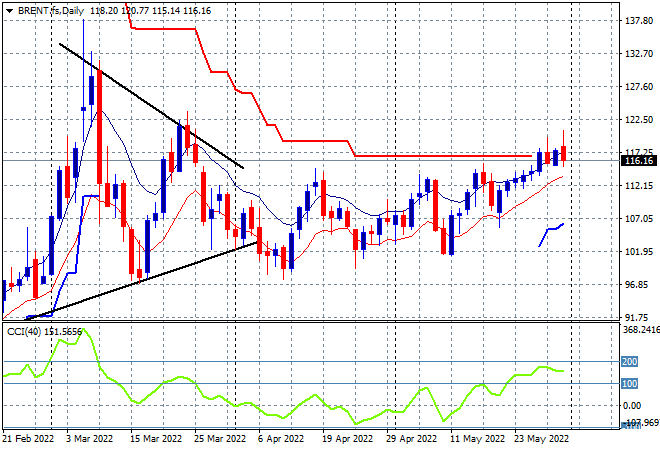
Oil markets pushed higher overnight on the return of US traders with both WTI and Brent up to a new two month high, although late selling saw them pullback to where they started on Friday. Brent eventually finished slightly above the $116USD per barrel level and while this still exceeds its previous weekly high, it keeps price hovering near the trailing ATR daily resistance. Daily momentum is very overextended and overbought so that should encourage further upside, but watch those overhead selling tails that are pointing to building resistance:
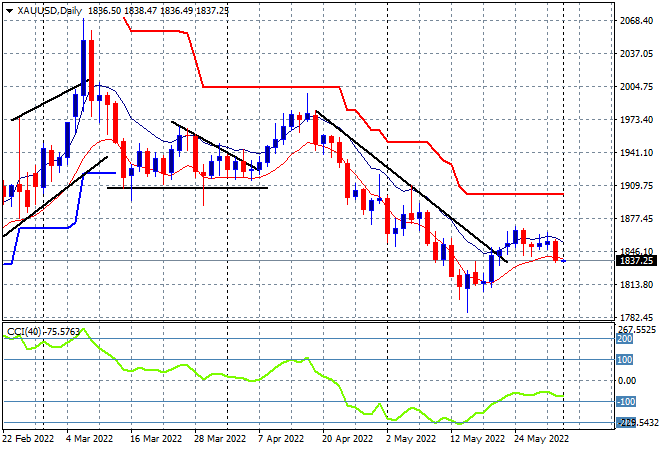
Gold not only stalled out but retraced overnight, as returning US traders looked at their longer term charts and added to their short positions, sending the shiny metal down to the $1837USD per ounce level, despite the USD remaining weak against the majors. The last week of price action is pointing to a rejoining of the downtrend from the April highs as daily momentum remains stuck in negative territory, with an inability to create a new daily high for over a week. The January lows around the $1800 level remain the downside target that has yet to transform into a new support level:
Glossary of Acronyms and Technical Analysis Terms:
ATR: Average True Range – measures the degree of price volatility averaged over a time period
ATR Support/Resistance: a ratcheting mechanism that follows price below/above a trend, that if breached shows above average volatility
CCI: Commodity Channel Index: a momentum reading that calculates current price away from the statistical mean or “typical” price to indicate overbought (far above the mean) or oversold (far below the mean)
Low/High Moving Average: rolling mean of prices in this case, the low and high for the day/hour which creates a band around the actual price movement
FOMC: Federal Open Market Committee, monthly meeting of Federal Reserve regarding monetary policy (setting interest rates)
DOE: US Department of Energy
Uncle Point: or stop loss point, a level at which you’ve clearly been wrong on your position, so cry uncle and get out!wrong on your position, so cry uncle and get out!