Goldman has the main points. The reality is very likely to be worse than this data suggests.
—
-
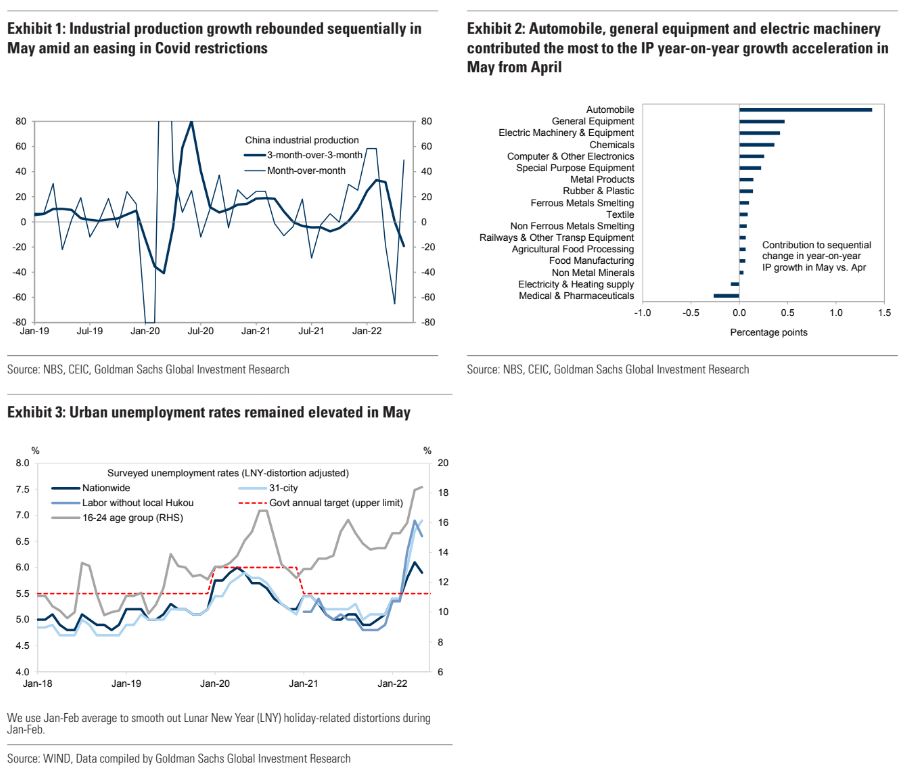
Industrial production (IP) rose by 0.7% yoy in May (vs. a 2.9% yoy contraction in April), beating market expectations. On a sequential basis after seasonal adjustments, it rebounded to +3.4% mom non-annualized in May from -8.4% in April as per our estimates (Exhibit 1). Automobile, general equipment and electric machinery contributed the most to the IP year-on-year growth acceleration in May from April (Exhibit 2), thanks to an easing in Covid restrictions, a gradual business resumption in some manufacturing hubs (e.g., Shanghai) and fewer supply chain disruptions. Output of steel product and cement continued to contract on a year-on-year basis in May, by 2.3% and 17.0% yoy, respectively (vs., -5.8% and -18.9% in April), likely due to still-subdued property-related construction and unfavorable weather conditions (especially in southern China).
-
Fixed asset investment (FAI) growth rose to +4.7% yoy in May from +2.3% in April (on a single-month basis based on our estimates), with strength broadly based but mainly led by the improvement in infrastructure FAI, growth of which increased meaningfully to +8.6% yoy in May from +6.0% in April on the back of more policysupport.
-
Manufacturing and property FAI growth also improved in May, rising to +7.2%and -7.7% yoy, respectively from +6.0% and -10.1% in April. Looking back at the past three years, annualized FAI growth was +4.7% yoy in May (annualized growth from May2019 to May 2022), below the +5.4% pace for full-year 2019.
-
Retail sales beat market expectations in May, with nominal and real retail sales growth rising to -6.7% and -9.7% yoy, respectively (vs. -11.1% and -14.0% in April).Online goods sales gained by 7.0% yoy in May (vs. a 5.6% yoy contraction in April). Year-on-year growth in automobile sales among medium/large dealers rose significantly to -16.0% yoy in May from -31.6% in April. Covid-sensitive catering sales growth remained depressed at -21.1% yoy in May (vs. -22.7% in April). On a sequential basis, retail sales rose by 7.1% mom non-annualized in May after seasonal adjustments (vs. -12.0% in April), and catering sales gained by 5.3% mom non-annualized (vs. -9.3% inApril).
-
The Services Industry Output Index, which is on a real basis and tracks tertiary GDP growth closely, contracted by -5.1% yoy in May, albeit less severe than in April (-6.1%yoy). In sequential terms, it rebounded to +2.1% mom sa non-annualized in May from-5.9% in April. Based on our estimates, its annualized growth over the past three years was +2.5% yoy in May, significantly below the pre-Covid pace.
-
Property-related data remained sluggish in May despite more housing policy easing. Property sales volume contracted by 31.8% yoy in May (vs. -39.0% in April; -48% yoy in May for30-city daily property sales volume that we track), and completions plunged by31.3% yoy in May (vs. -14.2% in April). Housing starts continued to contract sharply in May by 41.8% yoy (vs. -44.2% in April). Property-related retail sales were mixed in May,with home appliance sales contracted by 10.6% yoy in May (vs. -8.1% in April); year-on-year growth in sales of furniture and building materials improved modestly to-12.2% and -7.8% yoy, respectively, in May from -14.0% and -11.7% in April.
-
On the labor market, the nationwide unemployment rates (not seasonally adjusted) moderated to 5.9% in May from 6.1% in April, largely in line with its seasonal patterns(a 0.1pp sequential decline from April to May as implied by historical data). By comparison, 31-city surveyed unemployment rates rose further to 6.9% in May from 6.7% in April, registering a new record high and suggesting increased labor market pressure in large cities (Exhibit 3). The unemployment rate for labor without local Hukoudeclined slightly to 6.6% in May from 6.9% in April, while the unemployment rate for the 16-24 age group edged higher to 18.4% from 18.2%.
-
The easing in Covid restrictions, fewer supply chain disruptions and incrementally more policy stimulus contributed to the sequential growth recovery in May, while still-high unemployment rates pointed to significant slack in the economy. We expect further improvement in growth momentum in June thanks mainly to frontloaded policy stimulus and the gradual reopening of some large cities (especially Shanghai), although the pace could be less steep than in spring 2020. Fiscal(especially infrastructure) and credit easing may play a more important role in coming months amid the zero-Covid regime domestically and DM tightening cycles externally. Our high-frequency tracker salso point to a modest sequential improvement in some production activity in early June, despite continued weakness in the property sector.