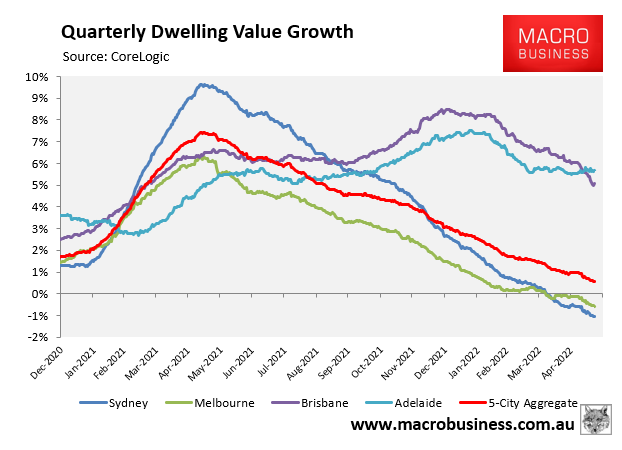
CoreLogic’s daily index shows that Sydney is leading Australia’s nascent housing market downturn, record a 1.0% decline in dwelling values over the quarter to be down 1.3% from mid-February’s price peak:
Sydney goes from boom to bust.
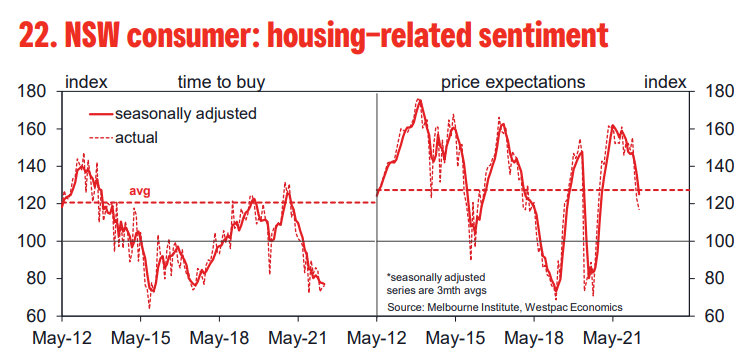
Westpac’s latest Housing Pulse shows a “sharp deterioration” across NSW housing indicators, suggesting there is “more to come near term” for Sydney’s house price correction:
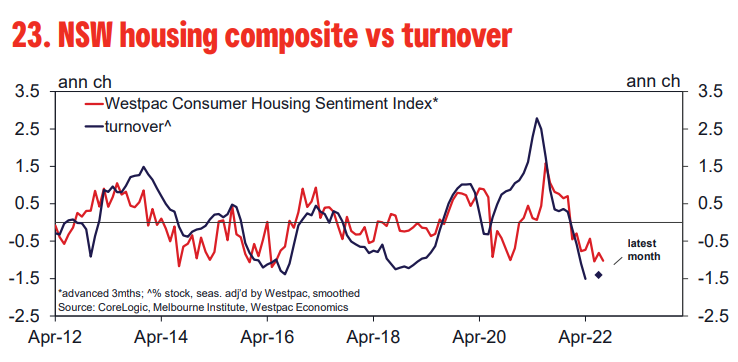
The boom is well and truly over in NSW. Turnover has fallen back sharply since the start of the year with Sydney dwelling prices now seeing slight declines. Our sentiment–based indicators suggest there is more to come near term.
Market turnover is off by nearly a quarter from its Dec peak to be back near its pre–COVID levels and below long run averages as a share of the dwelling stock.
Auction activity suggests the shift gained momentum following the RBA’s May interest rate rise, clearance rates falling to the 50–55% range mid–month and 20–25% of properties withdrawn prior to auction, volumes also subdued.
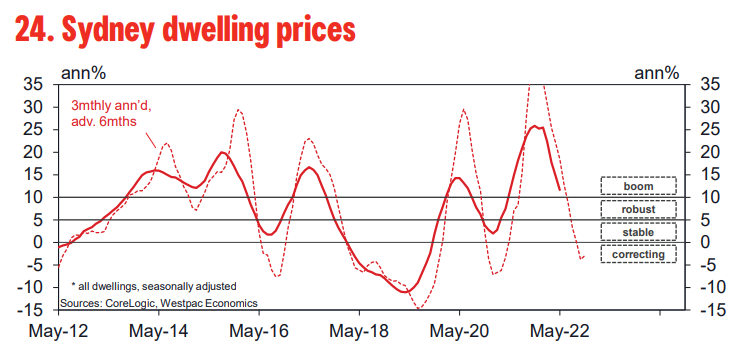
The latest price data is also showing a very clear signal, Sydney posting slight declines through each of the three months to Apr and the May month to date tracking a more meaningful 0.8% drop.
The price detail shows a more abrupt turnaround for houses and ‘top tier’ segments in Sydney after outperforming by a wide margin during the upturn. The ‘city and inner south’ has seen a more pronounced fall, fringe metro areas out–performing. Regional slowdowns have also been much milder.
The sharp turnaround is seeing the on–market supply–demand balance shift quickly, total listings already back to to just over three months of sales, a touch above the long run average. However houses are still in short supply compared to units.
The NSW Consumer Housing Sentiment index points to a further significant decline in turnover near term. The May index read is consistent with another 15% decline in sales through the Sep quarter.
Advertisement
As illustrated in the first chart above, Sydney led the nation’s dwelling price growth over the first 18 months of the pandemic, which has driven the city’s median dwelling value to an insane $1.13 million – 36% above the combined capital city average.
Sydney’s extreme unaffordability, combined with the fact that it has the nation’s most indebted households, means that it is most sensitive to interest rate hikes and should continue to lead the nation’s property price correction.
Leith van Onselen is Chief Economist at the MB Fund and MB Super. He is also a co-founder of MacroBusiness.
Leith has previously worked at the Australian Treasury, Victorian Treasury and Goldman Sachs.