
The bounce is in with Wall Street continuing its post FOMC Minutes bounce, with European shares also lifting as risk sentiment begins to firm. The USD fell back against the majors, particularly Euro while the Australian dollar looks poised to breakout again. The bond market range traded, although the 10 year US Treasury yield pushed back towards the 2.8% level, with interest rate markets confirming a 50 bps rise for the Fed’s June meeting. Commodity prices were somewhat bullish with oil prices breaking out again as Brent lifted 3% while gold further retraced below the $1850SD per ounce level .
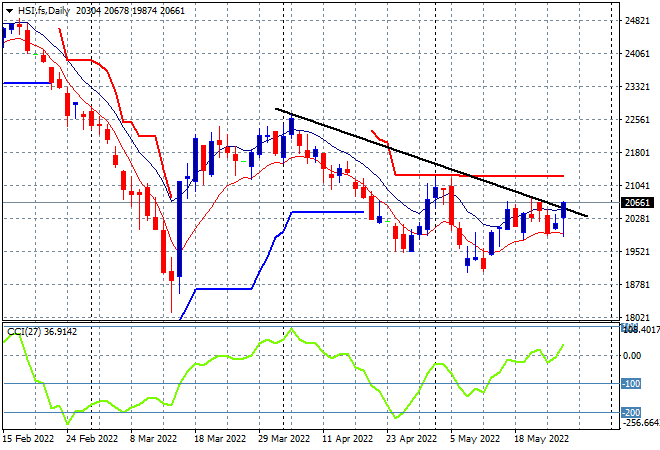
Looking at share markets in Asia from yesterday’s session, where mainland Chinese share markets have continued their rebound with the Shanghai Composite up 0.5% to 3123 points while the Hang Seng Index is falling back again, down nearly 0.3% but maintaining just above the 20000 point level. The daily chart is showing price action possibly getting some steam under it again but it remains contained below trailing daily ATR resistance at the 21000 point level that has firmed as strong resistance:
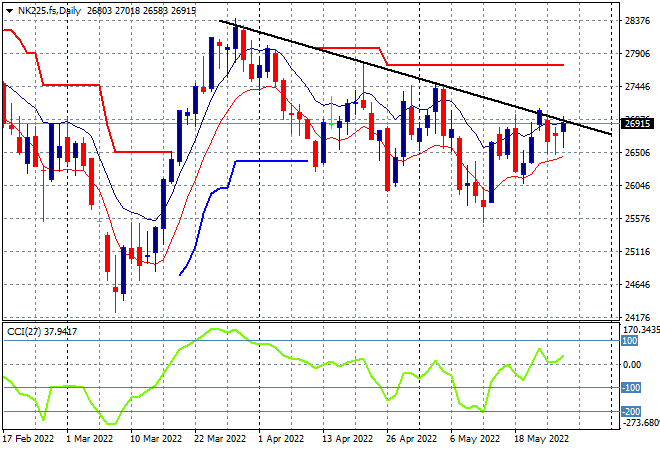
Japanese stock markets remained on the defence as well, with the Nikkei 225 index losing nearly 0.3% to close at 26604 points. The daily chart of the Nikkei 225 still has a bearish bent with another attempt to get back above the previous daily/weekly highs near the 27500 point level possibly underway as risk sentiment firms. To properly reverse the downward trend from the March highs requires a substantial move above the 27000 point level with futures are indicating a solid start despite a weaker Yen overnight:
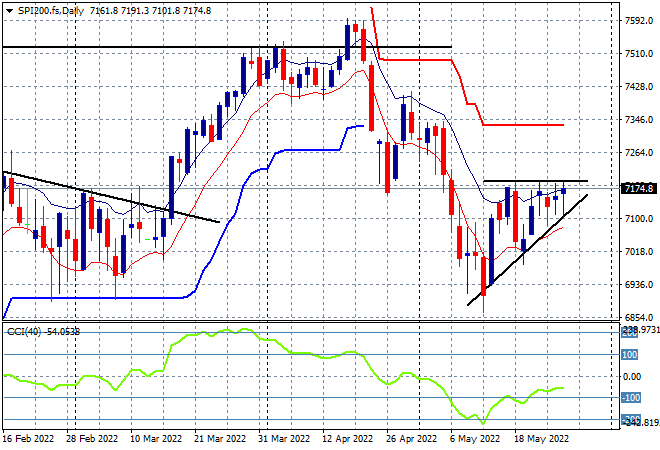
Australian stocks pulled back throughout the session with the ASX200 finishing 0.7% lower at 7105 points, and just keeping the key 7100 point support level intact. SPI futures are up a full 1% as the daily chart was showing a bunching up of price here at the 7100 point level which could embiggen a second bounce that could turn into a proper swing action up to the resistance level at 7200 points, but daily momentum readings remain tenuous:
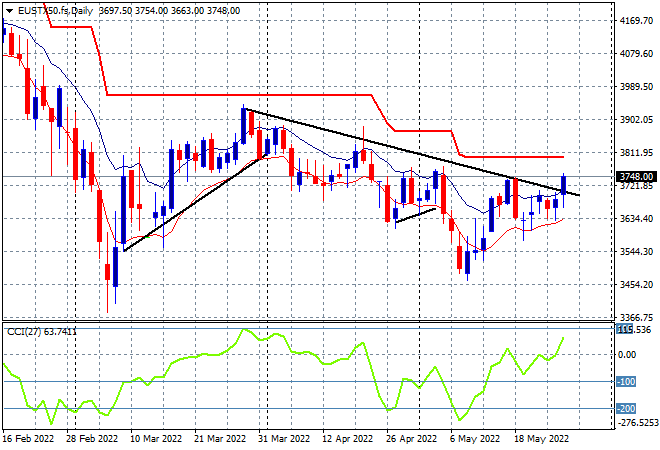
European markets started off in a poor state, slipping into the red but then made some midsize gains throughout the session and as Wall Street came online with the Eurostoxx 50 index finishing more than 1.7% higher at 3702 points. The daily chart picture is suggesting a breakout in the short term picture that could see a potential move back up to trailing ATR resistance at around 3800 points, with daily momentum finally popping to the positive side:
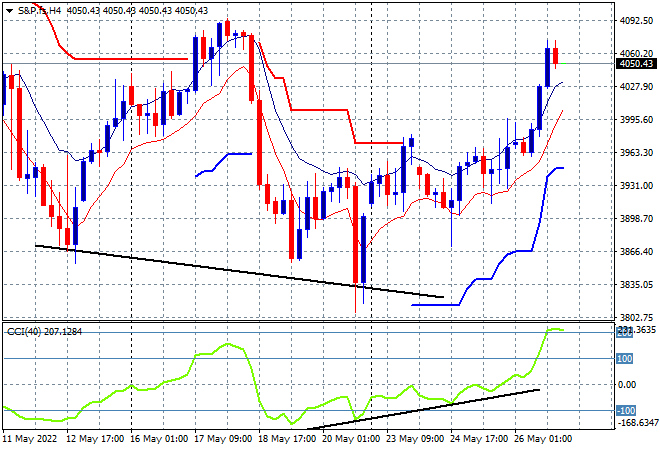
Wall Street remains in a volatile state but it was more upside this time, with the NASDAQ bouncing the highest, up nearly 3% while the S&P500 closed almost cracking the 2% mark higher as it zoomed past the psychologically important 4000 level. The four hourly chart is trying to get out of its unsettled stage as substantial resistance at the 4100 point level beckons to fill this quite large dip so far. I warned of a potential breakout here as momentum gathered towards 4000 points, but the next level that must be cleared to call this a bottom is the previous weekly high at the 4090 or even better 4100 point level:
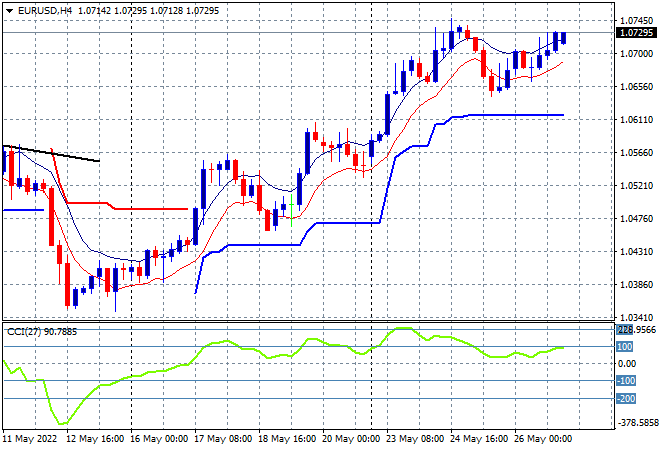
Currency markets saw a reversal of USD strength following the GDP estimates with Euro returning back to the 1.07 handle overnight, almost matching its mid week high. This confirms a new medium term uptrend is definitely underway here and has been solidified as trailing ATR support at the 1.06 level proper was defended. Watch for any retracement below the previous session lows at the mid 1.06 level to prove that wrong:
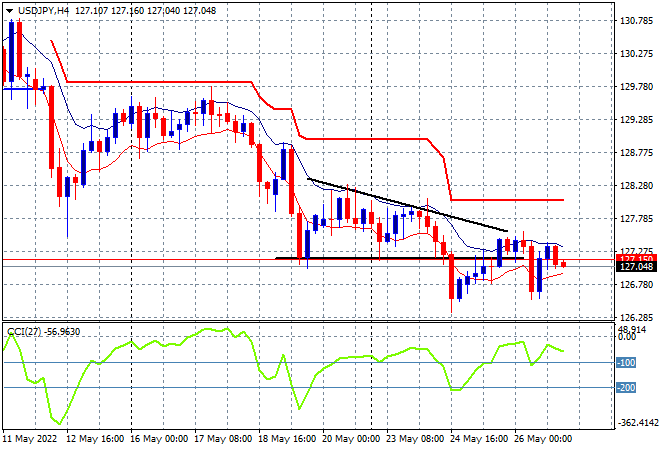
The USDJPY pair is looking wobbly again with another pullback to the 127 level as defensive Yen bidding has not yet abated. The descending triangle pattern on the four hourly chart has not yet been negated to the upside as momentum remains negative, as it setups another rollover and back down to the 126 handle instead:
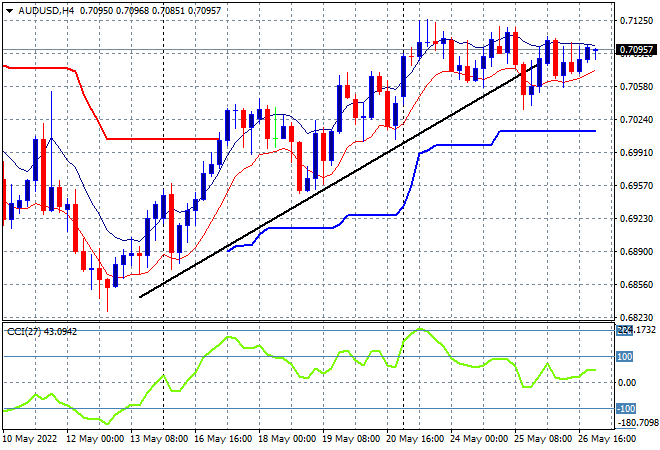
The Australian dollar was able to get back to its recent highs but didn’t exceed them, with price bunching up again at the 71 handle overnight. Four hourly momentum had been at extremely overbought levels and then retraced with my contention of catch up here to the trendline fulfilled and now positioning for another breakout. To get back above the 71 cent level requires a solid move above the high moving average on the four hourly chart:
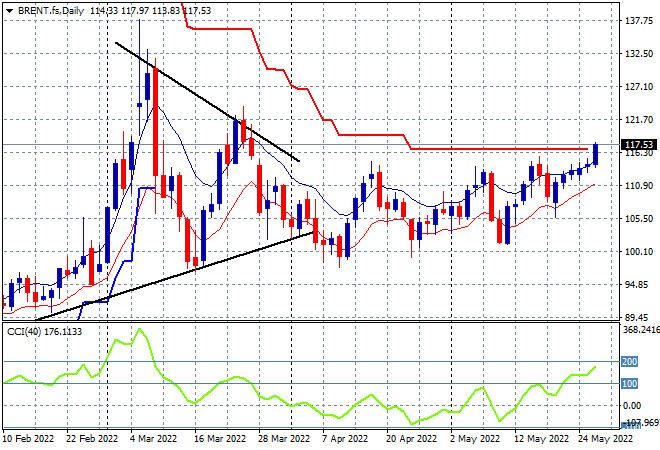
Oil markets finally broke out after a period of consolidation and a slow build up here that was fairly obvious with a series of daily sessions with higher lows and tighter intrasession volatility. Brent crude closed back above the $117USD per barrel level, exceeding its previous weekly high, and taking out trailing ATR daily resistance at the $116 area. Daily momentum is now properly overbought status that should encourage further upside:
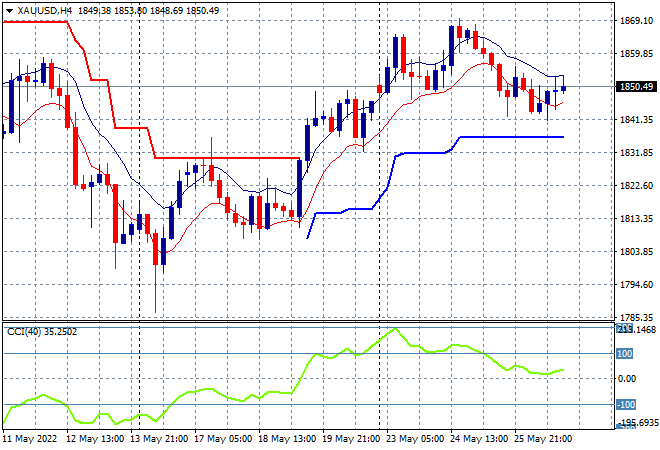
Gold stalled out again overnight, pulling to finish just above the $1850USD per ounce level, as USD flexed its strength. This nascent uptrend was looking better and continued to firm up the possibility of a bottom forming in the short term, but as I warned before the downtrend will remain entrenched as long as daily momentum remains stuck in oversold territory, with four hourly momentum just barely positive and only indicating a slowdown. The January lows around the $1800 level remain the downside target that has yet to transform into a new support level:
Glossary of Acronyms and Technical Analysis Terms:
ATR: Average True Range – measures the degree of price volatility averaged over a time period
ATR Support/Resistance: a ratcheting mechanism that follows price below/above a trend, that if breached shows above average volatility
CCI: Commodity Channel Index: a momentum reading that calculates current price away from the statistical mean or “typical” price to indicate overbought (far above the mean) or oversold (far below the mean)
Low/High Moving Average: rolling mean of prices in this case, the low and high for the day/hour which creates a band around the actual price movement
FOMC: Federal Open Market Committee, monthly meeting of Federal Reserve regarding monetary policy (setting interest rates)
DOE: US Department of Energy
Uncle Point: or stop loss point, a level at which you’ve clearly been wrong on your position, so cry uncle and get out!wrong on your position, so cry uncle and get out!