
Well the bounceback is finished and then some with Wall Street collapsing overnight in its worst run in nearly two years, with the NASDAQ losing nearly 5% in a single session. Sell in May and go away anyone? This was all about inflation concerns as the latest UK, Euro and Canadian inflation prints spiked above expectations combined with some serious earnings downgrades due to the price pressures. The bond market reacted but not as violently with the 10 year US Treasury yield firming back to the 2.9% level, with interest rate markets continue to price in nearly 2% of rate rises to come from the Fed by the end of the year. Meanwhile the USD regained its lost ground, with the Dollar Index up 0.5% as commodity currencies and other undollar assets swung lower again. Commodity prices all saw downside action as well, with WTI and Brent crude off by nearly 3% while gold bucked the trend with a scratch session to remain anchored just above the $1800USD per ounce level.
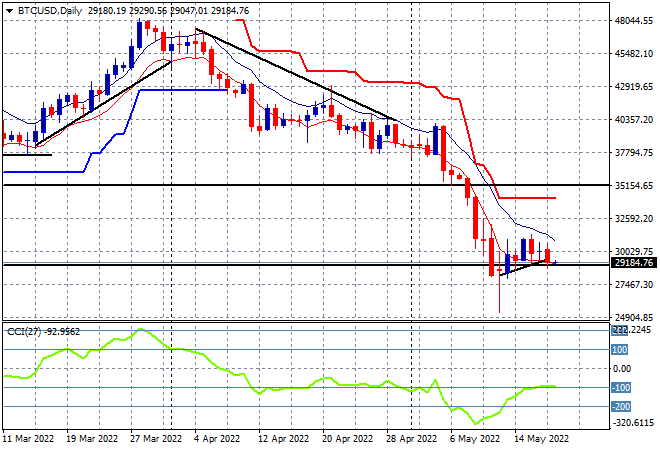
Bitcoin is still going nowhere, unable to get above the $30K level after cracking through the $25K level last week, deflating down to the $29K level as of this morning and looking very weak on the daily chart. Daily momentum remains oversold and price action is indicating a rollover is imminent:
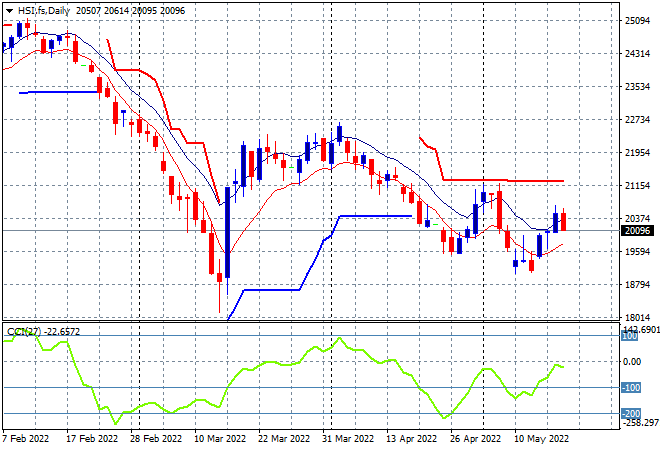
Looking at share markets in Asia from yesterday’s session, where mainland Chinese share markets struggled despite some encouraging news about lockdowns domestically with the Shanghai Composite closing down 0.25% to 3085 points while the Hang Seng Index recovered somewhat after a mid session dip, up 0.2% at 20644 points. The daily chart is showing price action wanting to lift higher yet its still below the high moving average with today’s action likely to see another reversal. Price is still nowhere near the trailing daily ATR resistance at the 21000 point level that continues to firm as strong resistance:
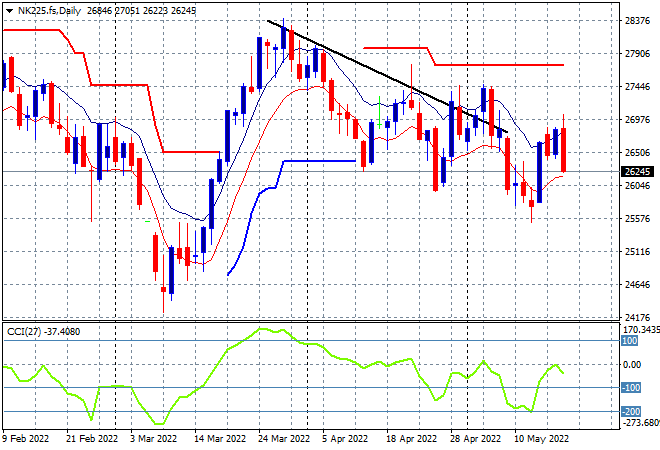
Japanese stock markets did much better, getting out of recovery mode with the Nikkei 225 up nearly 1% to 26911 points. The daily chart of the Nikkei 225 still has a bearish bent with a breakout above the previous daily/weekly highs near the 27500 point level required to properly reverse the downward trend from the March highs. Futures are indicating a large retracement however in line with the falls on Wall Street so that is very much unlikely:
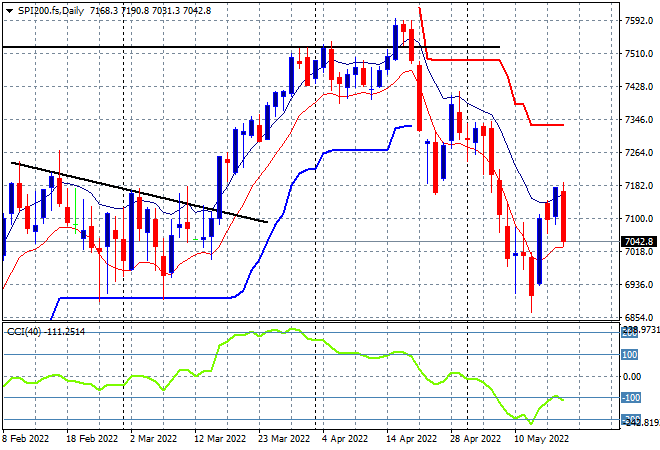
Australian stocks did the best in the region with another good session with the ASX200 up nearly 1% to 7182 points. SPI futures are indicating a huge slide on the open, down at least 1.5% on the Wall Street slump with the possibility of the 7000 point level taken out. The daily chart was showing a continuation of this bounce up towards the previous support, now resistance level at 7200 points but this is likely to turn into a dead cat bounce:
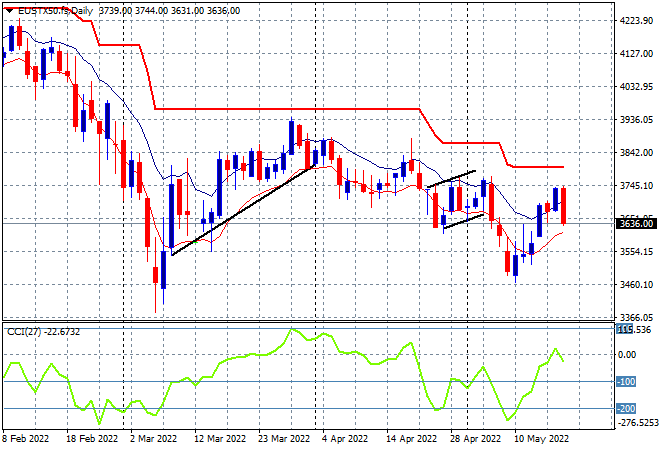
European shares replaced green with red across the board in the wake of the inflation prints with the Eurostoxx 50 index finishing 1.3% lower at 3690 points. As I’ve been warning for sometime, the daily chart picture remains bearish in the medium term, while the short term picture is about to turn ugly as the blood of bath on Wall Street spreads. A break above trailing ATR resistance at around 3800 points is required to indicate a proper bottoming action and this is growing increasingly unlikely:
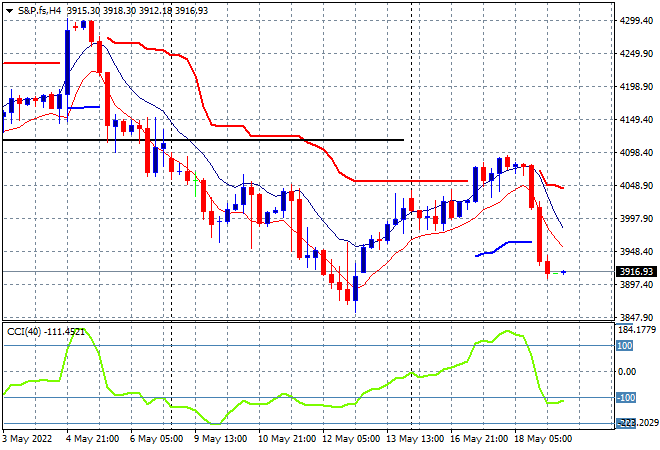
Wall Street wiped out all of its recent bounce, with the ever volatile NASDAQ losing nearly 5% while the S&P500 lost nearly as much, down 4% to head well below the key 4000 point support level, finishing at 3923 points. This was a very overdone reaction to inflation concerns, with the classic V-bottom trapping a lot of bulls here as price flops below trailing ATR resistance and returns almost to last week’s lows. Again proving that stocks walk up a flight of stairs and fall down elevator shafts:
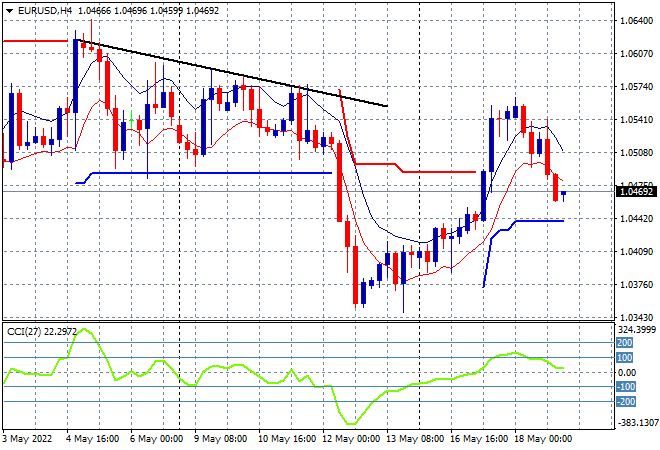
Currency markets are backing USD again following the inflation prints with the swing against King Dollar now finished. Euro returned below the 1.05 handle overnight, unable to sustain its recent new weekly high, rolling back over to its recent anchoring point and down below previous trailing ATR resistance level:
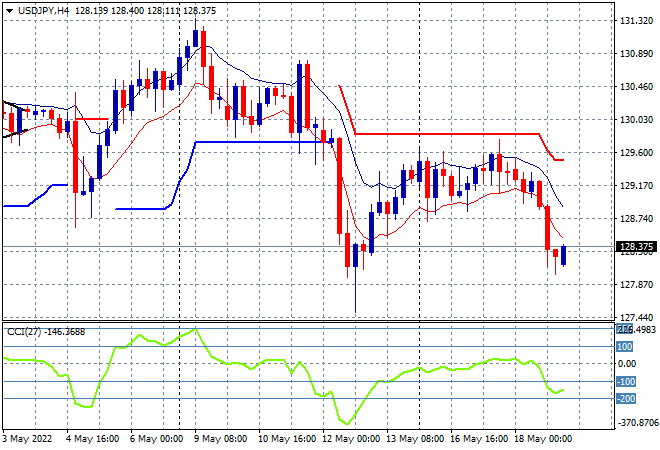
The USDJPY pair is no longer being contained with defensive Yen bidding see it lose its current support at the 129 level, falling back to the Friday night low at the 128.30 area instead. As I mentioned yesterday, while momentum was nominally positive, combined with price well below trailing ATR resistance the chance of a possible pullback was enhanced and here we are. Watch for a further fallback towards the 127 area:
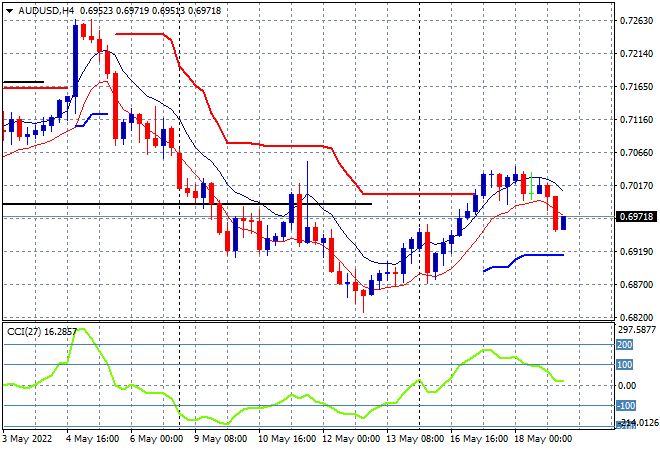
The Australian dollar had a classic rollover, heading back below the 70 level as the triple whammy inflation prints put it back in its place, at least in the short term. The bunching up of price around the 70 handle was ominous, given that it didn’t exceed the previous week intrasession high and while momentum in the short term is just barely positive there is a chance of a continued rollover here as risk markets diverge:
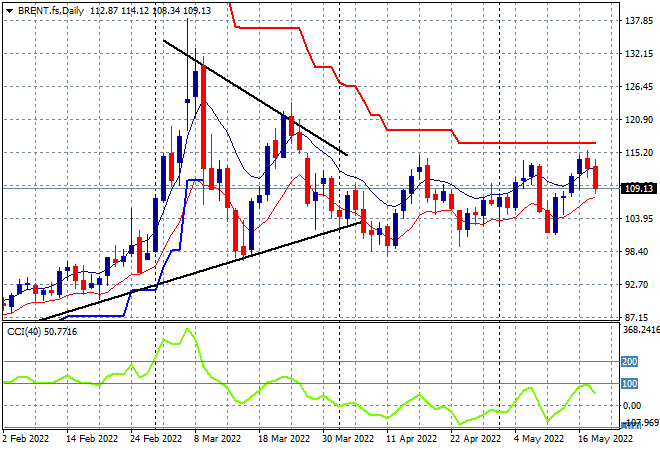
Oil markets pulled back a little more this time with Brent closing 3% lower at the $109USD per barrel level after briefly almost making a new weekly high but unable to hold on to those gains. Daily momentum remains nicely positive but not yet overbought so I remain cautious here with trailing ATR daily resistance at the $116 area the next level possibly stiffening here:
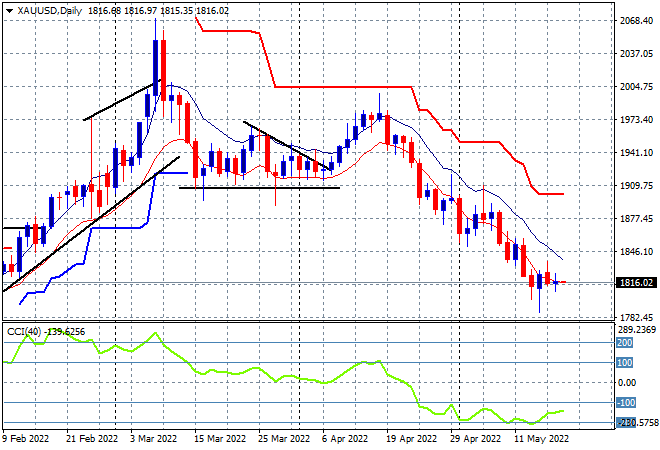
Gold is still anchored near the $1800USD per ounce level with a tiny bounce overnight that just managed to put in a new daily high, finishing at the $1816USD per ounce level. The possibility of a bottom forming here in the short term is fading , as this downtrend remains entrenched as daily momentum remains stuck in oversold territory. The January lows around the $1800 level remain the downside target that has yet to transform into a new support level:
Glossary of Acronyms and Technical Analysis Terms:
ATR: Average True Range – measures the degree of price volatility averaged over a time period
ATR Support/Resistance: a ratcheting mechanism that follows price below/above a trend, that if breached shows above average volatility
CCI: Commodity Channel Index: a momentum reading that calculates current price away from the statistical mean or “typical” price to indicate overbought (far above the mean) or oversold (far below the mean)
Low/High Moving Average: rolling mean of prices in this case, the low and high for the day/hour which creates a band around the actual price movement
FOMC: Federal Open Market Committee, monthly meeting of Federal Reserve regarding monetary policy (setting interest rates)
DOE: US Department of Energy
Uncle Point: or stop loss point, a level at which you’ve clearly been wrong on your position, so cry uncle and get out!wrong on your position, so cry uncle and get out!