
Friday night finally saw a proper bounceback on stock markets after weeks of downside volatility with Chinese shares leading the way into the European session and then Wall Street taking over after desperately trying to find a bottom in the mid-week. While the latest US consumer sentiment figures disappointed, the Fed is still ready to go all in on more interest rates, which is keeping currency markets in their place unlike their scruffy stock market cousins. The bond market moved around only a little with the 10 year US Treasury yield still flitting around the 2.8 to 2.9% level, with interest rate markets still forecasting nearly 2% of rate rises to come from the Fed by the end of the year. Meanwhile the USD pulled back slightly as some risk currencies swung a little higher but remains at a 20 year high with Euro still quite depressed. Commodity prices were generally good with oil lifting 4%, copper up nearly 2% while gold is also depressed to fall back to the $1800USD per ounce level.
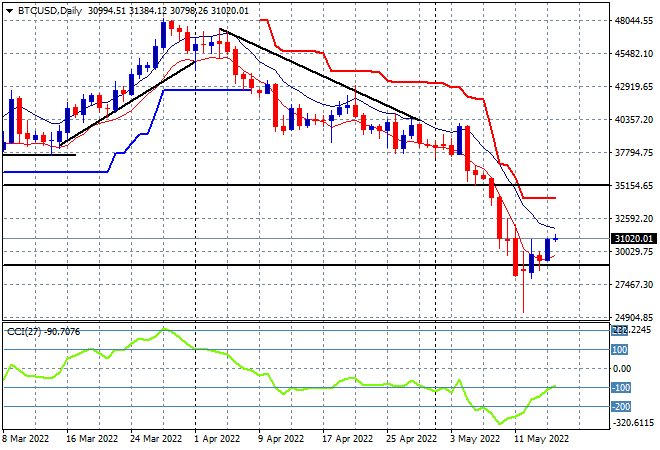
Bitcoin is desperately trying to get out of capitulation mode, finishing the week just above the $31K level after cracking through the $25K level at one stage in a very steep selloff. There’s going to be a lot of crypto chad’s hurting this week wanting to bid this back up, but this remains a swing play only with trailing resistance a long way away:
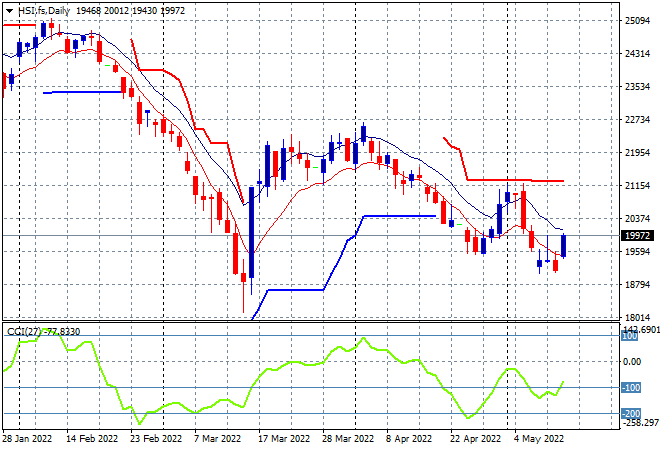
Looking at share markets in Asia from Friday’s session, where Chinese share markets had a solid session to finish the week, with the Shanghai Composite closing 1% higher at 3084 points while the Hang Seng Index romped it in, up nearly 3% to almost break through the 20000 point barrier, closing at 19898 points. The daily chart shows price action wanting to lift higher but still poised below the high moving average and still nowhere near the trailing daily ATR resistance at the 21000 point level as the overall picture still looks bearish despite a one off rally:
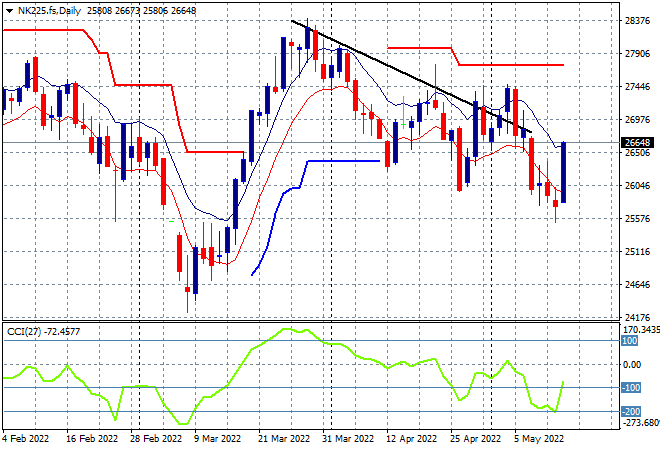
Japanese stock markets had an almost identical streak higher as well with the Nikkei pushing up 2.7% to 26427 points. The daily chart of the Nikkei 225 also has a bearish bent and requires a lot more upside from here to get traders more confident again. At a minimum a breakout above the previous daily/weekly highs near the 27500 point level is required to reverse the downward trend from the March highs, but this could be played as a swing long position up towards that level:
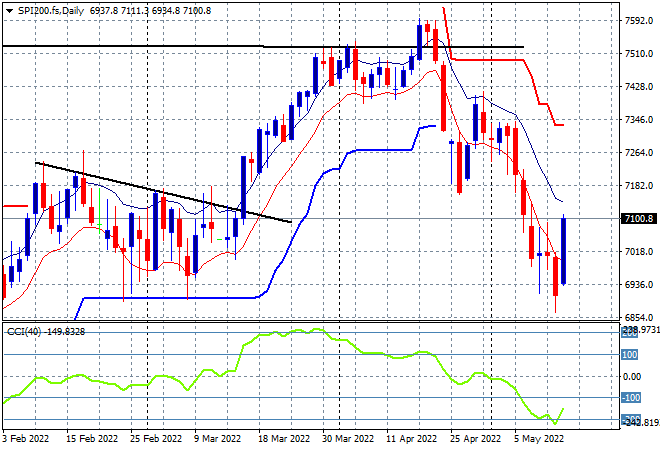
Australian stocks also had the zoom zooms with the ASX200 closing nearly 2% higher at 7075 points. SPI futures are indicating more upside on the open, with at least a 50 point lift or nearly 0.8% on the back of the Wall Street rally. The daily chart has a very interesting bullish engulfing candle above bouncing off below the 7000 point level so watch for a further close above the high moving average here next:
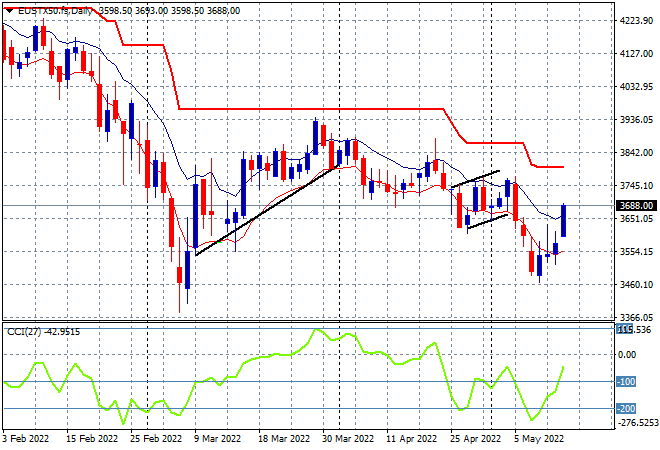
European shares finally had properly good sessions across the continent with the Eurostoxx 50 index up over 2.5% to finish at 3703 points. The daily chart picture remains bearish as the March lows still beckon but daily momentum has finally switched from very oversold to just nominally negative, but nothing will change until a close above trailing ATR resistance at around 3800 points at a minimum:
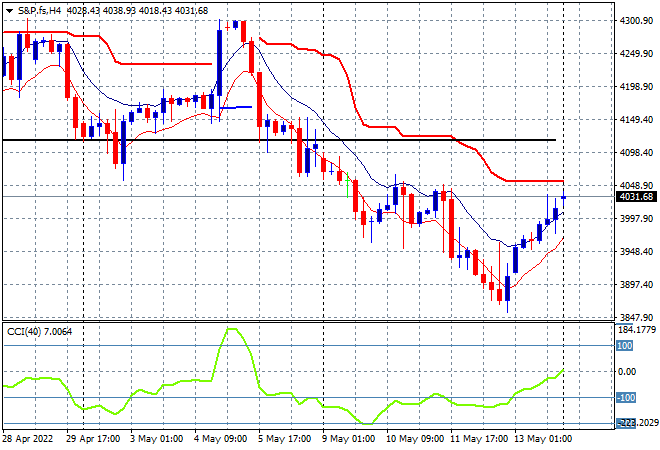
Wall Street also finally stopped falling with the NASDAQ leading the way, up over 3% while the S&P500 pipped back above the 4000 point key support level to finish 2.4% higher at 4023 points. The four hourly chart shows a classic V-bottom but price is not yet above trailing ATR resistance or the start of week session highs, so we must be cautious here, as price could easily rollover from there:
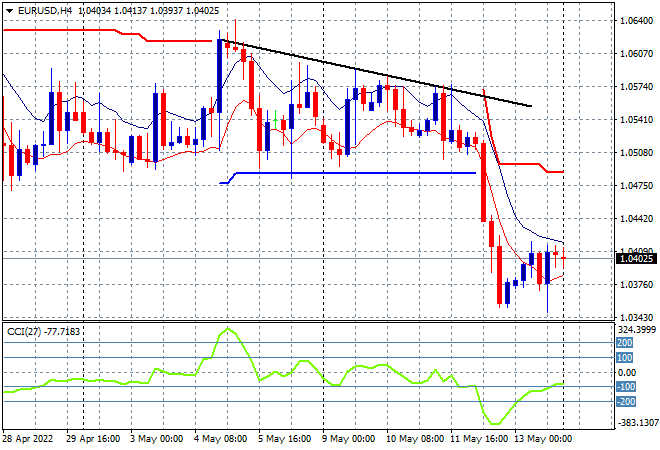
Currency markets are still relatively quiet despite share markets enjoying some bounceback volatility with Euro remaining quite deflated following a slew of economic data that doesn’t have a lot of upside potential versus the Fed’s hellbent desire to normalise rates. Price remains firmly anchored below the previous weekly low at the 1.05 handle and while short term momentum is slowly moving back from its oversold settings the conditions for a swing trade are not yet in place with trailing ATR resistance level at the 1.05 level proper a long distance away:
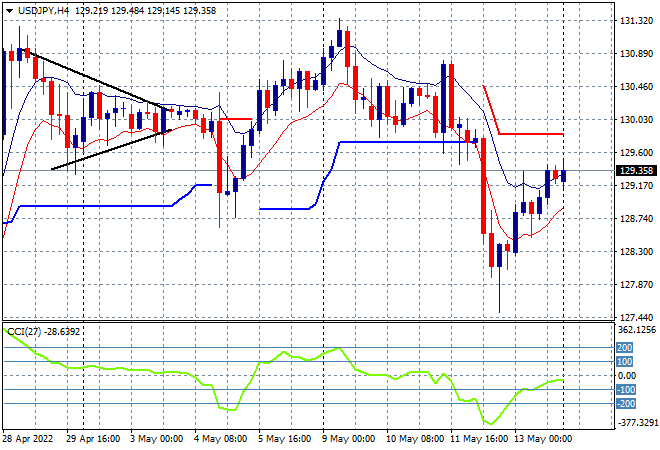
The USDJPY pair is bouncing back after its midweek crunch that took it down to the 127 handle, now back just above the 129 level as short term momentum creates an obvious swing opportunity. This still keeps price below new trailing ATR resistance with short term momentum remaining in the negative zone so watch for a possible pullback towards the 128 area:
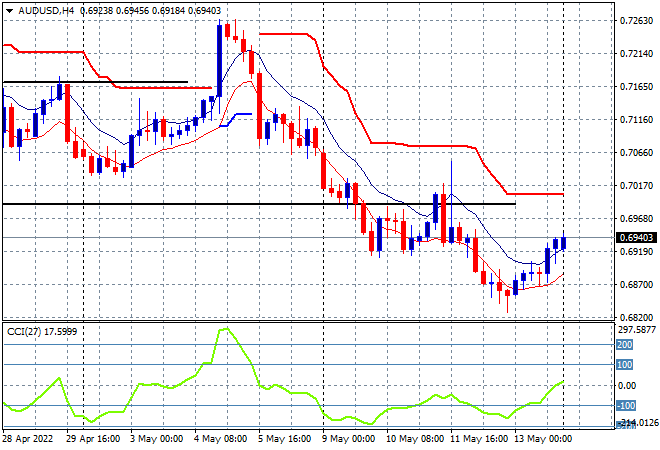
The Australian dollar had a very mild uplift on Friday night after breaking through the 69 handle in the previous session, becoming obviously oversold and ripe for a bounceback. But this is still not enough just yet to bring it back to weekly support at the key 70 handle as the longer term bearish picture is still forming as part of a multi month technical setup. Watch for any break below the recent session lows at the 69 level proper:
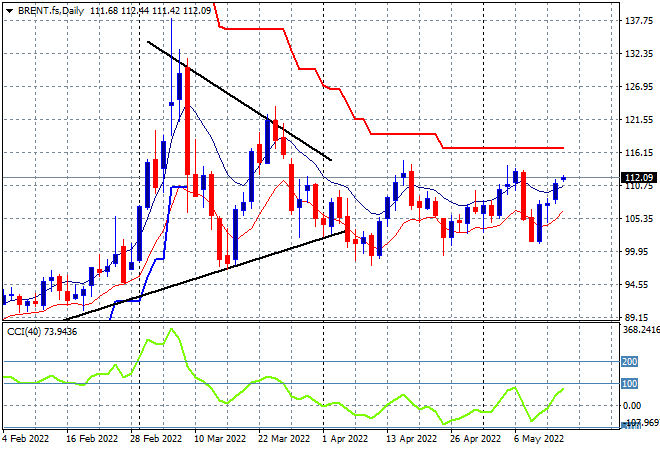
Oil markets have put in another meagre uplift, but still failed to make a new weekly high with Brent closing at the $112USD per barrel level on Friday night. Daily momentum remains nicely positive but not yet overbought so I’m cautious here that there’s anymore upside with swing trades to dominate in the short term:
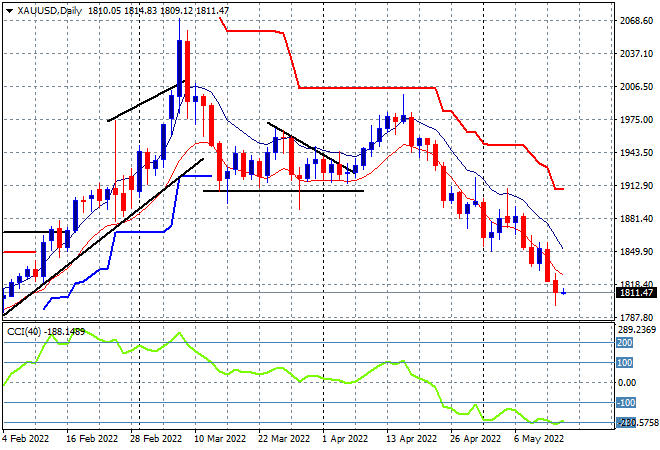
Gold is still under the pump with more selling on Friday night, finishing just above the $1800USD per ounce level, after being contained well below the $1900USD per ounce level all week which continues to prove itself as strong short and medium term resistance. This downtrend is entrenched as daily momentum remains stuck in oversold territory with the January lows around the $1800 level very close indeed:
Glossary of Acronyms and Technical Analysis Terms:
ATR: Average True Range – measures the degree of price volatility averaged over a time period
ATR Support/Resistance: a ratcheting mechanism that follows price below/above a trend, that if breached shows above average volatility
CCI: Commodity Channel Index: a momentum reading that calculates current price away from the statistical mean or “typical” price to indicate overbought (far above the mean) or oversold (far below the mean)
Low/High Moving Average: rolling mean of prices in this case, the low and high for the day/hour which creates a band around the actual price movement
FOMC: Federal Open Market Committee, monthly meeting of Federal Reserve regarding monetary policy (setting interest rates)
DOE: US Department of Energy
Uncle Point: or stop loss point, a level at which you’ve clearly been wrong on your position, so cry uncle and get out!wrong on your position, so cry uncle and get out!